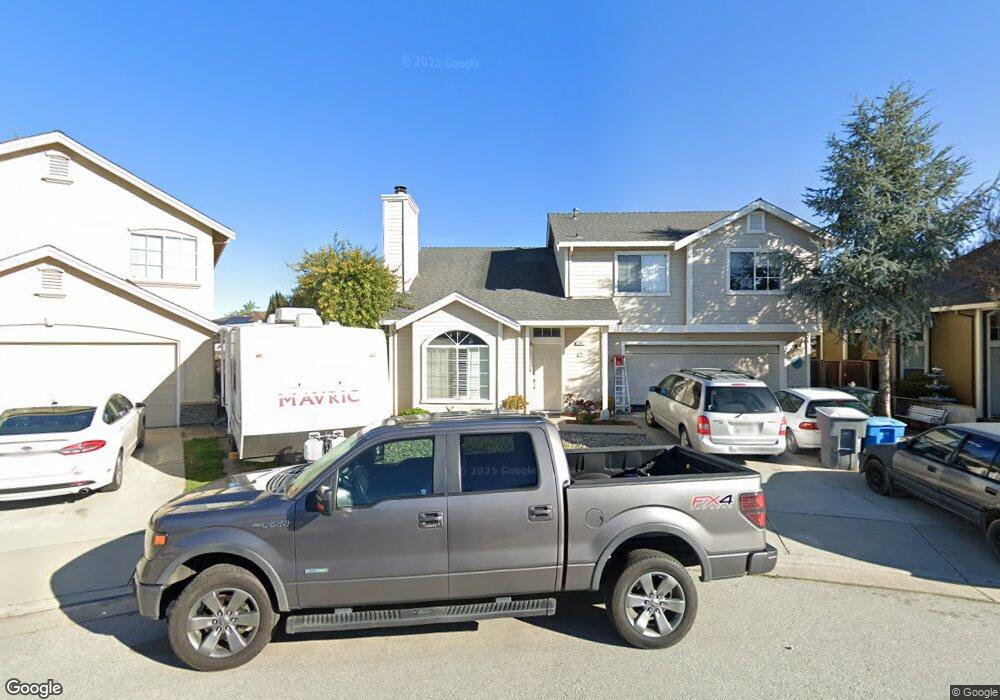
241 Chappell Ct Gilroy, CA 95020
Las Animas NeighborhoodEstimated Value: $781,000 - $921,000
3
Beds
3
Baths
1,280
Sq Ft
$669/Sq Ft
Est. Value
About This Home
This home is located at 241 Chappell Ct, Gilroy, CA 95020 and is currently estimated at $856,120, approximately $668 per square foot. 241 Chappell Ct is a home located in Santa Clara County with nearby schools including South Valley Middle School, Solorsano Middle School, and Christopher High School.
Ownership History
Date
Name
Owned For
Owner Type
Purchase Details
Closed on
Oct 3, 2020
Sold by
Woon Sew K and Nyam Sik S
Bought by
Nyam-Woon Family Living Trust and Nyam
Current Estimated Value
Purchase Details
Closed on
Sep 11, 2009
Sold by
Us Bank National Association
Bought by
Woon Sew K and Nyam Sik S
Home Financials for this Owner
Home Financials are based on the most recent Mortgage that was taken out on this home.
Original Mortgage
$210,000
Interest Rate
5.14%
Mortgage Type
New Conventional
Purchase Details
Closed on
Jun 2, 2009
Sold by
Becerra Juan Jose
Bought by
Us Bank National Association
Purchase Details
Closed on
Nov 7, 2006
Sold by
Galvan Rosa Elvia Perez
Bought by
Becerra Juan Jose
Home Financials for this Owner
Home Financials are based on the most recent Mortgage that was taken out on this home.
Original Mortgage
$128,600
Interest Rate
6.28%
Mortgage Type
Stand Alone Second
Purchase Details
Closed on
Nov 3, 2006
Sold by
Nook Doug E and Nook Natalia
Bought by
Becerra Juan Jose
Home Financials for this Owner
Home Financials are based on the most recent Mortgage that was taken out on this home.
Original Mortgage
$128,600
Interest Rate
6.28%
Mortgage Type
Stand Alone Second
Purchase Details
Closed on
Apr 2, 2003
Sold by
Nook Natalie
Bought by
Nook Doug E
Home Financials for this Owner
Home Financials are based on the most recent Mortgage that was taken out on this home.
Original Mortgage
$191,500
Interest Rate
5.71%
Mortgage Type
Purchase Money Mortgage
Purchase Details
Closed on
Oct 31, 2002
Sold by
Logan James
Bought by
Logan James and Logan Janea
Purchase Details
Closed on
Nov 30, 2000
Sold by
Giannini Denise L
Bought by
Nook Doug E
Home Financials for this Owner
Home Financials are based on the most recent Mortgage that was taken out on this home.
Original Mortgage
$20,000
Interest Rate
7.89%
Mortgage Type
Stand Alone Second
Purchase Details
Closed on
Oct 24, 2000
Sold by
Nook Doug E and Giannini Denise L
Bought by
Nook Douglas E
Home Financials for this Owner
Home Financials are based on the most recent Mortgage that was taken out on this home.
Original Mortgage
$20,000
Interest Rate
7.89%
Mortgage Type
Stand Alone Second
Purchase Details
Closed on
Nov 25, 1996
Sold by
Hewell Properties
Bought by
Nook Doug E and Giannini Denise L
Home Financials for this Owner
Home Financials are based on the most recent Mortgage that was taken out on this home.
Original Mortgage
$180,400
Interest Rate
7.86%
Create a Home Valuation Report for This Property
The Home Valuation Report is an in-depth analysis detailing your home's value as well as a comparison with similar homes in the area
Home Values in the Area
Average Home Value in this Area
Purchase History
| Date | Buyer | Sale Price | Title Company |
|---|---|---|---|
| Nyam-Woon Family Living Trust | -- | None Listed On Document | |
| Woon Sew K | $312,000 | Ticor Title San Benardino | |
| Us Bank National Association | $290,000 | Servicelink | |
| Becerra Juan Jose | -- | Old Republic Title Company | |
| Becerra Juan Jose | $643,000 | Old Republic Title Company | |
| Nook Doug E | -- | Stewart Title Of California | |
| Logan James | -- | -- | |
| Nook Doug E | -- | -- | |
| Nook Douglas E | -- | Landsafe Title Company | |
| Nook Doug E | $190,000 | Old Republic Title Company |
Source: Public Records
Mortgage History
| Date | Status | Borrower | Loan Amount |
|---|---|---|---|
| Previous Owner | Woon Sew K | $210,000 | |
| Previous Owner | Becerra Juan Jose | $128,600 | |
| Previous Owner | Becerra Juan Jose | $514,400 | |
| Previous Owner | Nook Doug E | $191,500 | |
| Previous Owner | Nook Douglas E | $20,000 | |
| Previous Owner | Nook Doug E | $180,400 |
Source: Public Records
Tax History Compared to Growth
Tax History
| Year | Tax Paid | Tax Assessment Tax Assessment Total Assessment is a certain percentage of the fair market value that is determined by local assessors to be the total taxable value of land and additions on the property. | Land | Improvement |
|---|---|---|---|---|
| 2025 | $4,969 | $402,720 | $193,616 | $209,104 |
| 2024 | $4,969 | $394,824 | $189,820 | $205,004 |
| 2023 | $4,940 | $387,084 | $186,099 | $200,985 |
| 2022 | $4,858 | $379,495 | $182,450 | $197,045 |
| 2021 | $4,836 | $372,055 | $178,873 | $193,182 |
| 2020 | $4,783 | $368,241 | $177,039 | $191,202 |
| 2019 | $4,739 | $361,021 | $173,568 | $187,453 |
| 2018 | $4,427 | $353,943 | $170,165 | $183,778 |
| 2017 | $4,519 | $347,004 | $166,829 | $180,175 |
| 2016 | $4,424 | $340,201 | $163,558 | $176,643 |
| 2015 | $4,176 | $335,092 | $161,102 | $173,990 |
| 2014 | $4,149 | $328,529 | $157,947 | $170,582 |
Source: Public Records
Map
Nearby Homes
- 9135 Desiderio Way
- 345 Ronan Ave
- 100 Block Ronan Ave
- 201 Ronan Ave
- 495 Ronan Ave
- 190 Ronan Ave
- 103 Farrell Ave
- 111 Farrell Ave
- 119 Farrell Ave
- 264 Windsong Way
- 722 Carver Place
- 8420 David Ct
- 820 Woodcreek Way
- 796 Gary St
- 0 Apn 835-07-018 and Apn 835-07-019 Ave Unit ML82018888
- 1 Poli Rd
- 0 Dorrance Rd Unit ML82002071
- 0000 Hecker Pass
- 9360 Benbow Dr
- 9650 Santa Teresa Blvd
- 231 Chappell Ct
- 251 Chappell Ct
- 9011 Church St
- 9007 Church St
- 221 Chappell Ct
- 380 La Primavera Way
- 261 Chappell Ct
- 8976 Taos Way
- 211 Chappell Ct
- 390 La Primavera Way
- 260 Chappell Ct
- 240 Chappell Ct
- 250 Chappell Ct
- 8980 Taos Way
- 230 Chappell Ct
- 9003 Church St
- 8970 Taos Way
- 8987 Church St
- 220 Chappell Ct
- 8994 Taos Way