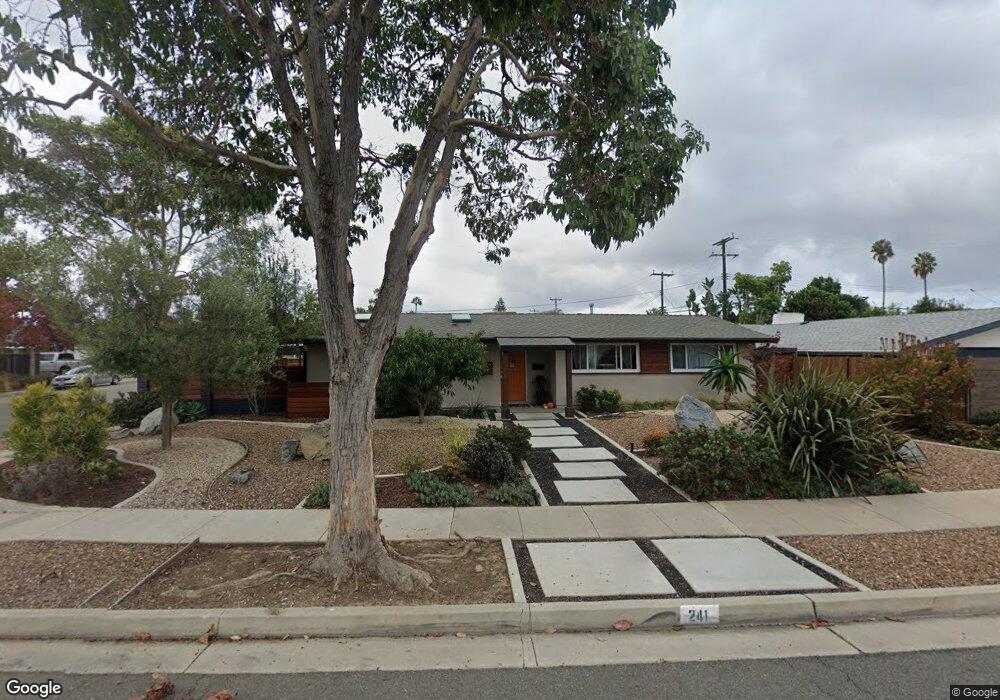
241 Hanover Dr Costa Mesa, CA 92626
Estimated Value: $1,492,000 - $1,669,000
4
Beds
2
Baths
1,785
Sq Ft
$875/Sq Ft
Est. Value
About This Home
This home is located at 241 Hanover Dr, Costa Mesa, CA 92626 and is currently estimated at $1,562,077, approximately $875 per square foot. 241 Hanover Dr is a home located in Orange County with nearby schools including College Park Elementary School, Costa Mesa High School, and Montessori Christian School.
Ownership History
Date
Name
Owned For
Owner Type
Purchase Details
Closed on
Dec 9, 2020
Sold by
Tamblyn Garth and Tamblyn Lea A
Bought by
Tamblyn Garth H and Tamblyn Lea A
Current Estimated Value
Home Financials for this Owner
Home Financials are based on the most recent Mortgage that was taken out on this home.
Original Mortgage
$428,000
Interest Rate
2.7%
Mortgage Type
New Conventional
Purchase Details
Closed on
Jun 10, 2020
Sold by
Tamblyn Garth and Tamblyn Lea A
Bought by
Tamblyn Garth H and Tamblyn Lea A
Home Financials for this Owner
Home Financials are based on the most recent Mortgage that was taken out on this home.
Original Mortgage
$430,000
Interest Rate
3.2%
Mortgage Type
New Conventional
Purchase Details
Closed on
Dec 12, 2019
Sold by
Tamblyn Garth H and Tamblyn Lea A
Bought by
Tamblyn Garth H and Tamblyn Lea A
Home Financials for this Owner
Home Financials are based on the most recent Mortgage that was taken out on this home.
Original Mortgage
$430,000
Interest Rate
3.6%
Mortgage Type
New Conventional
Purchase Details
Closed on
Mar 14, 2013
Sold by
Tamblyn Garth H and Tamblyn Lea A
Bought by
Tamblyn Garth H and Tamblyn Lea A
Home Financials for this Owner
Home Financials are based on the most recent Mortgage that was taken out on this home.
Original Mortgage
$390,000
Interest Rate
3.49%
Mortgage Type
New Conventional
Purchase Details
Closed on
May 15, 2009
Sold by
Tamblyn Garth H and Tamblyn Lea A
Bought by
Tamblyn Garth H and Tamblyn Lea A
Home Financials for this Owner
Home Financials are based on the most recent Mortgage that was taken out on this home.
Original Mortgage
$343,000
Interest Rate
4.78%
Mortgage Type
New Conventional
Purchase Details
Closed on
Mar 13, 2006
Sold by
Tamblyn Garth H and Tamblyn Lea A
Bought by
Tamblyn Garth H and Tamblyn Lea A
Home Financials for this Owner
Home Financials are based on the most recent Mortgage that was taken out on this home.
Original Mortgage
$335,500
Interest Rate
5.22%
Mortgage Type
Purchase Money Mortgage
Purchase Details
Closed on
Apr 23, 2001
Sold by
Tamblyn Garth H and Tamblyn Lea A
Bought by
Tamblyn Garth H and Tamblyn Lea A
Home Financials for this Owner
Home Financials are based on the most recent Mortgage that was taken out on this home.
Original Mortgage
$237,900
Interest Rate
6.98%
Purchase Details
Closed on
Jun 16, 1998
Sold by
Garth Tamblyn and Garth Lea
Bought by
Tamblyn Garth H and Tamblyn Lea
Create a Home Valuation Report for This Property
The Home Valuation Report is an in-depth analysis detailing your home's value as well as a comparison with similar homes in the area
Home Values in the Area
Average Home Value in this Area
Purchase History
| Date | Buyer | Sale Price | Title Company |
|---|---|---|---|
| Tamblyn Garth H | -- | Accommodation | |
| Tamblyn Garth | -- | Wfg National Title | |
| Tamblyn Garth H | -- | Accommodation | |
| Tamblyn Garth | -- | Wfg Title Company Of Ca | |
| Tamblyn Garth H | -- | Wfg Title | |
| Tamblyn Garth H | -- | Wfg Title Company Of Ca | |
| Tamblyn Garth H | -- | Accommodation | |
| Tamblyn Garth H | -- | Wfg Title Company Of Ca | |
| Tamblyn Garth H | -- | Chicago Title Company | |
| Tamblyn Garth H | -- | Chicago Title Company | |
| Tamblyn Garth H | -- | Accommodation | |
| Tamblyn Garth H | -- | Alliance Title Company | |
| Tamblyn Garth H | -- | Fidelity National Title Co | |
| Tamblyn Garth H | -- | -- |
Source: Public Records
Mortgage History
| Date | Status | Borrower | Loan Amount |
|---|---|---|---|
| Closed | Tamblyn Garth | $428,000 | |
| Closed | Tamblyn Garth | $430,000 | |
| Closed | Tamblyn Garth H | $430,000 | |
| Closed | Tamblyn Garth H | $390,000 | |
| Closed | Tamblyn Garth H | $343,000 | |
| Closed | Tamblyn Garth H | $335,500 | |
| Closed | Tamblyn Garth H | $237,900 |
Source: Public Records
Tax History Compared to Growth
Tax History
| Year | Tax Paid | Tax Assessment Tax Assessment Total Assessment is a certain percentage of the fair market value that is determined by local assessors to be the total taxable value of land and additions on the property. | Land | Improvement |
|---|---|---|---|---|
| 2025 | $5,214 | $407,403 | $297,186 | $110,217 |
| 2024 | $5,214 | $399,415 | $291,359 | $108,056 |
| 2023 | $5,023 | $391,584 | $285,646 | $105,938 |
| 2022 | $4,829 | $383,906 | $280,045 | $103,861 |
| 2021 | $4,672 | $376,379 | $274,554 | $101,825 |
| 2020 | $4,540 | $372,520 | $271,739 | $100,781 |
| 2019 | $4,442 | $365,216 | $266,411 | $98,805 |
| 2018 | $4,352 | $358,055 | $261,187 | $96,868 |
| 2017 | $4,280 | $351,035 | $256,066 | $94,969 |
| 2016 | $4,191 | $344,152 | $251,045 | $93,107 |
| 2015 | $4,149 | $338,983 | $247,274 | $91,709 |
| 2014 | $4,056 | $332,343 | $242,430 | $89,913 |
Source: Public Records
Map
Nearby Homes
- 117 Clearbrook Ln
- 101 Clearbrook Ln
- 135 Morristown Ln
- 2404 Niagara Way
- 2408 Saratoga Way
- 403 Aura Dr
- 2371 Rutgers Dr
- 2330 Vanguard Way Unit F102
- 419 Aura Dr
- 2314 Colgate Dr
- 2323 Cornell Dr
- 2547 Cornerstone Ln
- 1202 Hazel Place
- 2273 Columbia Dr
- 2750 San Carlos Ln
- 2865 Mendoza Dr
- 1030 Palmetto Way
- 1034 El Camino Dr
- 380 W Wilson St Unit C101
- 2459 Elden Ave
- 245 Hanover Dr
- 2575 Columbia Dr
- 249 Hanover Dr
- 229 Hanover Dr
- 2571 Columbia Dr
- 240 Hanover Dr
- 234 Hanover Dr
- 246 Bowling Green Dr
- 244 Hanover Dr
- 2572 Columbia Dr
- 253 Hanover Dr
- 223 Hanover Dr
- 228 Hanover Dr
- 2567 Columbia Dr
- 250 Hanover Dr
- 2568 Yale Place
- 222 Wellesley Ln
- 252 Bowling Green Dr
- 222 Hanover Dr
- 259 Hanover Dr