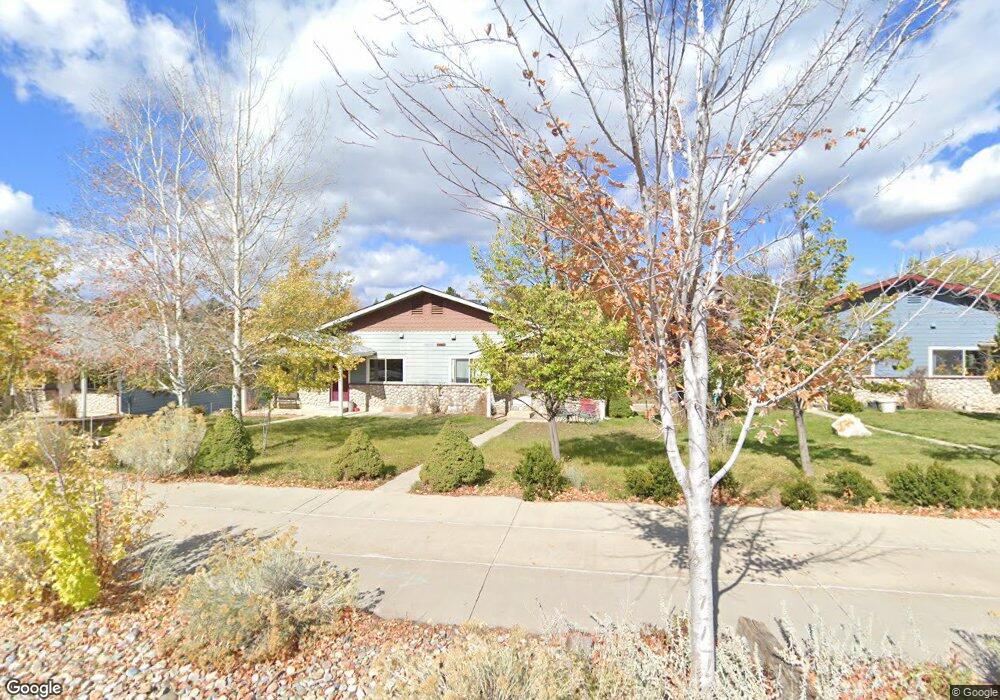
241 Jenkins Ranch Rd Durango, CO 81301
Skyridge NeighborhoodEstimated Value: $528,000 - $651,000
3
Beds
2
Baths
1,417
Sq Ft
$430/Sq Ft
Est. Value
About This Home
This home is located at 241 Jenkins Ranch Rd, Durango, CO 81301 and is currently estimated at $608,867, approximately $429 per square foot. 241 Jenkins Ranch Rd is a home located in La Plata County with nearby schools including Park Elementary School, Escalante Middle School, and Durango High School.
Ownership History
Date
Name
Owned For
Owner Type
Purchase Details
Closed on
Sep 9, 2020
Sold by
Sharla Sadler
Bought by
Mckeand Kevin and Mckeand Debra S
Current Estimated Value
Home Financials for this Owner
Home Financials are based on the most recent Mortgage that was taken out on this home.
Original Mortgage
$288,000
Outstanding Balance
$252,073
Interest Rate
2.9%
Mortgage Type
New Conventional
Estimated Equity
$356,794
Purchase Details
Closed on
Aug 2, 2018
Sold by
Tillotson Kari L and Escher Kari Lynn Tillotson
Bought by
Sadler Sharla
Purchase Details
Closed on
Nov 7, 2012
Sold by
Tillotson Todd D
Bought by
Tillotson Kari L
Purchase Details
Closed on
Jan 23, 2008
Sold by
Tillotson Kari L
Bought by
Tillotson Todd D and Tillotson Kari L
Purchase Details
Closed on
Aug 10, 2001
Bought by
Tillotson Kari L
Create a Home Valuation Report for This Property
The Home Valuation Report is an in-depth analysis detailing your home's value as well as a comparison with similar homes in the area
Home Values in the Area
Average Home Value in this Area
Purchase History
| Date | Buyer | Sale Price | Title Company |
|---|---|---|---|
| Mckeand Kevin | $360,000 | Land Title | |
| Sadler Sharla | $380,000 | Land Title Gurantee Co | |
| Tillotson Kari L | -- | None Available | |
| Tillotson Todd D | -- | None Available | |
| Tillotson Kari L | $30,500 | -- |
Source: Public Records
Mortgage History
| Date | Status | Borrower | Loan Amount |
|---|---|---|---|
| Open | Mckeand Kevin | $288,000 |
Source: Public Records
Tax History
| Year | Tax Paid | Tax Assessment Tax Assessment Total Assessment is a certain percentage of the fair market value that is determined by local assessors to be the total taxable value of land and additions on the property. | Land | Improvement |
|---|---|---|---|---|
| 2025 | $1,217 | $39,030 | $5,790 | $33,240 |
| 2024 | $1,035 | $25,750 | $4,340 | $21,410 |
| 2023 | $1,035 | $28,700 | $4,840 | $23,860 |
| 2022 | $1,010 | $30,530 | $5,150 | $25,380 |
| 2021 | $1,014 | $25,550 | $4,250 | $21,300 |
| 2020 | $947 | $24,630 | $4,110 | $20,520 |
| 2019 | $906 | $24,630 | $4,110 | $20,520 |
| 2018 | $864 | $23,780 | $3,970 | $19,810 |
| 2017 | $845 | $23,780 | $3,970 | $19,810 |
| 2016 | $816 | $25,020 | $4,180 | $20,840 |
| 2015 | $764 | $25,020 | $4,180 | $20,840 |
| 2014 | -- | $19,750 | $2,540 | $17,210 |
| 2013 | -- | $19,750 | $2,540 | $17,210 |
Source: Public Records
Map
Nearby Homes
- 229 Jenkins Ranch Rd Unit D
- 210 Jenkins Ranch Rd
- 205 Jenkins Ranch Rd Unit A
- 311 Hillcrest Dr Unit 4
- 126 Linda Ct
- 1100 Goeglein Gulch Rd Unit 254
- 1100 Goeglein Gulch Rd Unit 155
- 1100 Goeglein Gulch Rd Unit 223
- 1100 Goeglein Gulch Rd Unit 133
- 105 Tierra Vista Dr
- 6 Ferringway Cir Unit 30
- 6 Ferringway Cir Unit 18
- TBD Cedar Ridge Way
- 35 Valle Vista Way
- 517 Jenkins Ranch Rd
- 900 Florida Rd
- 2801 Elm Place
- 762 Goeglein Gulch Rd Unit 5
- 762 Goeglein Gulch Rd Unit 1
- 1200 Florida Rd Unit 33
- 243 Jenkins Ranch Rd
- 239 Jenkins Ranch Rd
- 245 Jenkins Ranch Rd
- 237 Jenkins Ranch Rd
- 247 Jenkins Ranch Rd
- 233 Jenkins Ranch Rd Unit D
- 233 Jenkins Ranch Rd Unit C
- 233 Jenkins Ranch Rd Unit B
- 233 Jenkins Ranch Rd Unit A
- 233 Jenkins Ranch Rd
- 236 Jenkins Ranch Rd
- 234 Jenkins Ranch Rd
- 238 Jenkins Ranch Rd
- 249 Jenkins Ranch Rd
- 257 Jenkins Ranch Rd
- 230 Jenkins Ranch Rd
- 3 Ophir Dr
- 229 Jenkins Ranch Rd Unit C
- 229 Jenkins Ranch Rd Unit B
- 229 Jenkins Ranch Rd Unit A
Your Personal Tour Guide
Ask me questions while you tour the home.