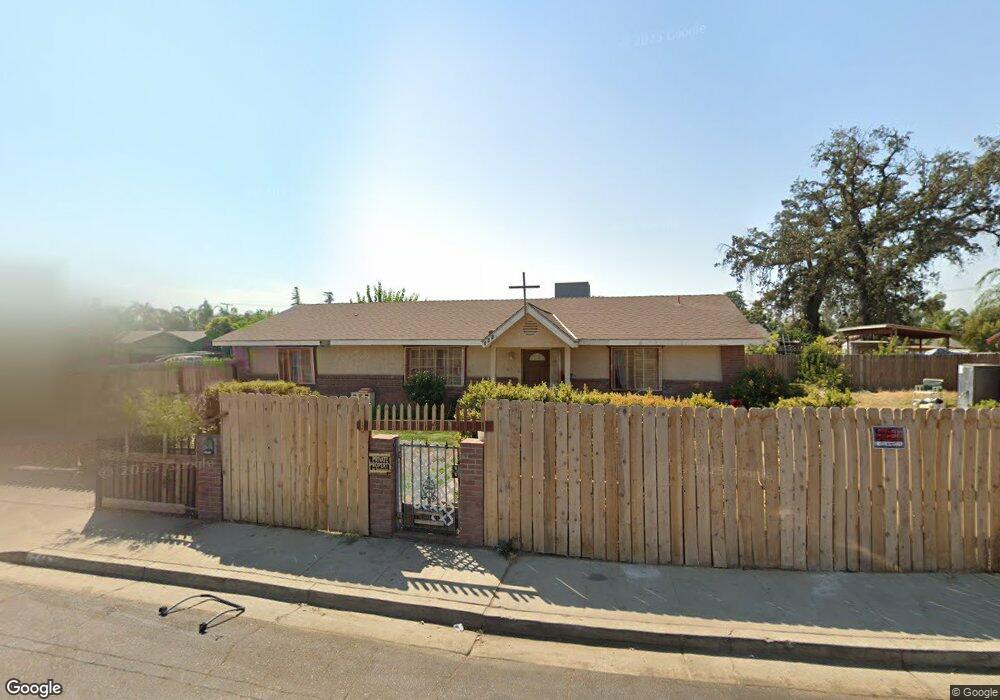
241 W Perez Ave Visalia, CA 93291
North Visalia NeighborhoodEstimated Value: $256,000 - $391,000
4
Beds
3
Baths
1,621
Sq Ft
$208/Sq Ft
Est. Value
About This Home
This home is located at 241 W Perez Ave, Visalia, CA 93291 and is currently estimated at $336,556, approximately $207 per square foot. 241 W Perez Ave is a home located in Tulare County with nearby schools including Crowley Elementary School, Divisadero Middle School, and Mt. Whitney High School.
Ownership History
Date
Name
Owned For
Owner Type
Purchase Details
Closed on
Oct 22, 2002
Sold by
Northcutt Louise
Bought by
Toscano Kari
Current Estimated Value
Home Financials for this Owner
Home Financials are based on the most recent Mortgage that was taken out on this home.
Original Mortgage
$61,451
Interest Rate
5.97%
Mortgage Type
FHA
Purchase Details
Closed on
Feb 1, 2000
Sold by
Gillett Robert Donat
Bought by
Andrews David and Northcutt Louise
Home Financials for this Owner
Home Financials are based on the most recent Mortgage that was taken out on this home.
Original Mortgage
$62,000
Interest Rate
8.21%
Mortgage Type
Seller Take Back
Purchase Details
Closed on
Jun 25, 1997
Sold by
Gillett Robert D
Bought by
Gillett Robert Donat and Gillett Arlina S
Purchase Details
Closed on
Jul 23, 1996
Sold by
German Humberto
Bought by
Gillett Robert D and Gillett Arlina S
Create a Home Valuation Report for This Property
The Home Valuation Report is an in-depth analysis detailing your home's value as well as a comparison with similar homes in the area
Home Values in the Area
Average Home Value in this Area
Purchase History
| Date | Buyer | Sale Price | Title Company |
|---|---|---|---|
| Toscano Kari | $62,000 | Fidelity National Title Co | |
| Andrews David | $66,000 | -- | |
| Gillett Robert Donat | -- | -- | |
| Gillett Robert D | $69,477 | Old Republic Title Company |
Source: Public Records
Mortgage History
| Date | Status | Borrower | Loan Amount |
|---|---|---|---|
| Previous Owner | Toscano Kari | $61,451 | |
| Previous Owner | Andrews David | $62,000 |
Source: Public Records
Tax History
| Year | Tax Paid | Tax Assessment Tax Assessment Total Assessment is a certain percentage of the fair market value that is determined by local assessors to be the total taxable value of land and additions on the property. | Land | Improvement |
|---|---|---|---|---|
| 2025 | $1,342 | $133,747 | $43,449 | $90,298 |
| 2024 | $1,342 | $131,126 | $42,598 | $88,528 |
| 2023 | $1,303 | $128,556 | $41,763 | $86,793 |
| 2022 | $1,244 | $126,037 | $40,945 | $85,092 |
| 2021 | $1,244 | $123,566 | $40,142 | $83,424 |
| 2020 | $1,228 | $122,299 | $39,730 | $82,569 |
| 2019 | $1,196 | $119,901 | $38,951 | $80,950 |
| 2018 | $1,160 | $117,550 | $38,187 | $79,363 |
| 2017 | $1,151 | $115,245 | $37,438 | $77,807 |
| 2016 | $1,123 | $112,985 | $36,704 | $76,281 |
| 2015 | $1,089 | $111,288 | $36,153 | $75,135 |
| 2014 | $1,089 | $109,108 | $35,445 | $73,663 |
Source: Public Records
Map
Nearby Homes
- 223 W Buena Vista Ave
- 0 W Ferguson Ave Unit 214901
- 729 W Perez Ave
- 441 W Glenhaven Ct
- 237 E Modoc Ave
- 203 E Harold Ct
- 1540 N Encina St
- 201 E Elowin Ct
- 219 E Elowin Ct
- 1432 N Locust St
- 125 N Hicks St Unit B
- 125 N Hicks St Unit A
- 1420 N Court St
- 438 E Oakridge Ct
- 1215 N Court St
- 321 NW 3rd Ave
- 1217 N Stevenson St
- 315 NE 3rd Ave
- 1708 N Oak Park St
- 811 E Trinidad Ave
- 2125 N Garcia St
- 2115 N Garcia St
- 245 W Perez Ave
- 217 W Perez Ave
- 249 W Perez Ave
- 308 W Vine Ave
- 2105 N Garcia St
- 2124 N Garcia St
- 207 W Perez Ave
- 316 W Vine Ave
- 210 W Vine Ave
- 206 W Vine Ave
- 145 W Perez Ave
- 507 N Summers St
- 509 N Summers St
- 505 N Summers St
- 511 N Summers St
- 245 W Vine Ave
- 503 N Summers St
- 144 W Perez Ave
Your Personal Tour Guide
Ask me questions while you tour the home.