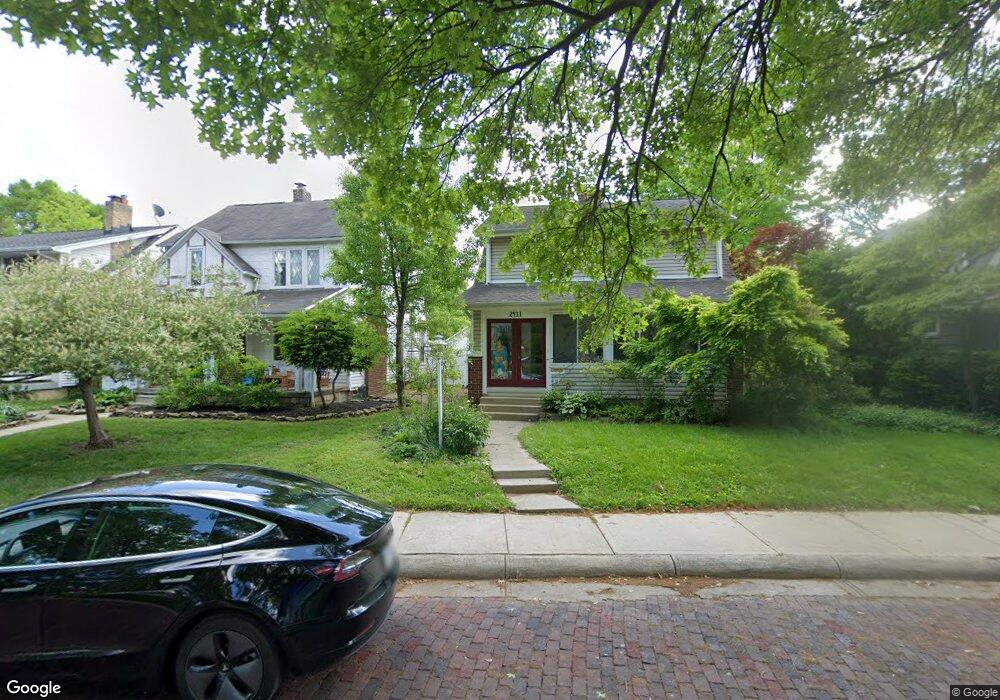
2411 S Havenwood Dr Columbus, OH 43209
Estimated Value: $466,530 - $619,000
2
Beds
3
Baths
2,032
Sq Ft
$261/Sq Ft
Est. Value
About This Home
This home is located at 2411 S Havenwood Dr, Columbus, OH 43209 and is currently estimated at $530,383, approximately $261 per square foot. 2411 S Havenwood Dr is a home located in Franklin County with nearby schools including Montrose Elementary School, Bexley Middle School, and Bexley High School.
Ownership History
Date
Name
Owned For
Owner Type
Purchase Details
Closed on
Jan 12, 2022
Sold by
Schopick Philip J
Bought by
Philip And Carol Schopick Irrevocable Trust and Irre Carol
Current Estimated Value
Purchase Details
Closed on
Dec 9, 2021
Sold by
Schopick Philip J
Bought by
Philip And Carol Schopick Irrevocable Trust
Purchase Details
Closed on
Mar 27, 1991
Bought by
Schopick Philip J
Purchase Details
Closed on
Jan 18, 1991
Purchase Details
Closed on
Feb 24, 1989
Create a Home Valuation Report for This Property
The Home Valuation Report is an in-depth analysis detailing your home's value as well as a comparison with similar homes in the area
Home Values in the Area
Average Home Value in this Area
Purchase History
| Date | Buyer | Sale Price | Title Company |
|---|---|---|---|
| Philip And Carol Schopick Irrevocable Trust | -- | Dupont And Blumenstiel Llc | |
| Philip And Carol Schopick Irrevocable Trust | -- | Dupont And Blumenstiel Llc | |
| Schopick Philip J | $88,000 | -- | |
| -- | -- | -- | |
| -- | -- | -- |
Source: Public Records
Tax History Compared to Growth
Tax History
| Year | Tax Paid | Tax Assessment Tax Assessment Total Assessment is a certain percentage of the fair market value that is determined by local assessors to be the total taxable value of land and additions on the property. | Land | Improvement |
|---|---|---|---|---|
| 2024 | $6,865 | $123,620 | $40,460 | $83,160 |
| 2023 | $6,172 | $123,620 | $40,460 | $83,160 |
| 2022 | $6,748 | $108,540 | $19,670 | $88,870 |
| 2021 | $6,753 | $108,540 | $19,670 | $88,870 |
| 2020 | $6,694 | $108,540 | $19,670 | $88,870 |
| 2019 | $6,359 | $90,720 | $16,380 | $74,340 |
| 2018 | $5,357 | $90,720 | $16,380 | $74,340 |
| 2017 | $5,392 | $90,720 | $16,380 | $74,340 |
| 2016 | $5,173 | $79,530 | $17,120 | $62,410 |
| 2015 | $5,188 | $79,530 | $17,120 | $62,410 |
| 2014 | $5,218 | $79,530 | $17,120 | $62,410 |
| 2013 | $2,583 | $75,740 | $16,310 | $59,430 |
Source: Public Records
Map
Nearby Homes
- 905 Vernon Rd
- 891 Vernon Rd
- 782 S Remington Rd
- 866-868 Sheridan Ave
- 1052 S Roosevelt Ave
- 696 Vernon Rd
- 789 Chelsea Ave
- 843 Kenwick Rd
- 1000 S Dawson Ave Unit 302
- 2736 Eastminster Rd
- 2770 Eastminster Rd
- 2425 Bryden Rd
- 2676 Tudor Rd
- 1205 Kenwick Rd
- 2350 Bryden Rd
- 2877 Astor Ave
- 2856 Eastminster Rd
- 794 S Chesterfield Rd
- 2807 Dover Rd
- 849 Lyman Ave
- 2405 S Havenwood Dr
- 2415 S Havenwood Dr
- 2415 Havenwood Dr S
- 2399 S Havenwood Dr
- 2419 S Havenwood Dr
- 941 S Cassingham Rd
- 920 Euclaire Ave
- 2391 S Havenwood Dr
- 2395 Charles St
- 934 Euclaire Ave
- 924 S Cassingham Rd
- 930 S Cassingham Rd
- 916 S Cassingham Rd
- 910 S Cassingham Rd
- 908 S Cassingham Rd
- 944 S Cassingham Rd
- 953 S Cassingham Rd
- 944 Euclaire Ave
- 902 S Cassingham Rd
- 950 S Cassingham Rd