24118 Trailhead Dr Aldie, VA 20105
Willowsford NeighborhoodEstimated payment $8,382/month
About This Lot
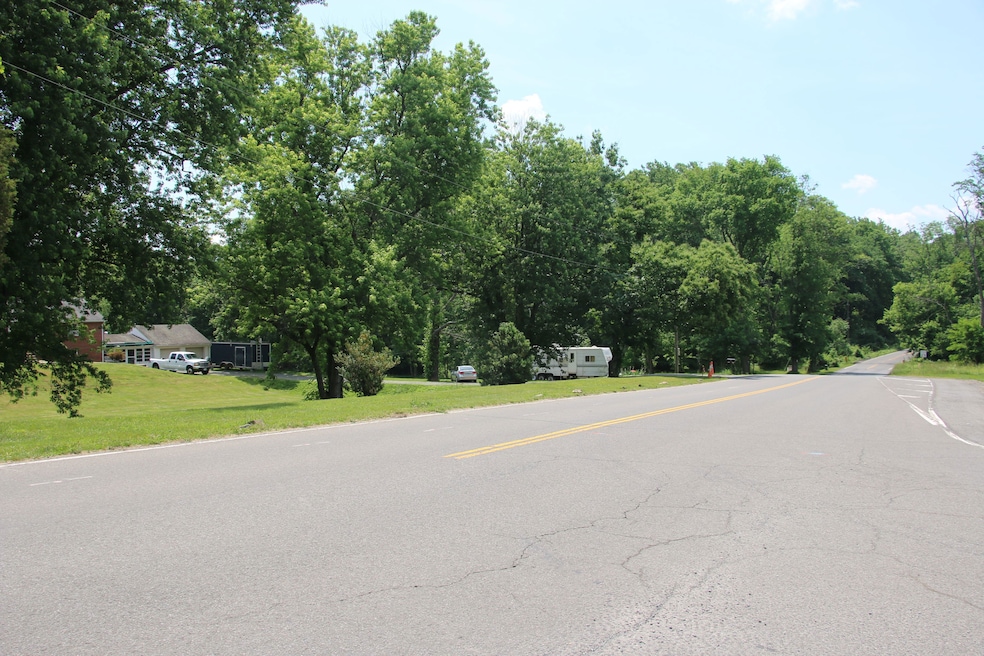
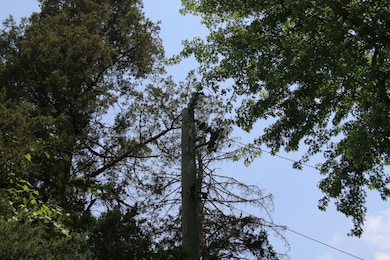
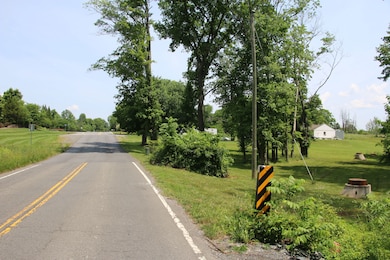
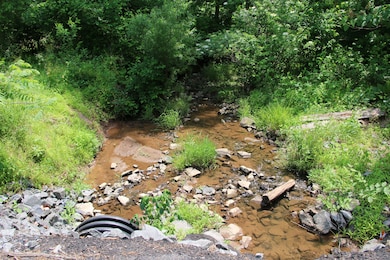
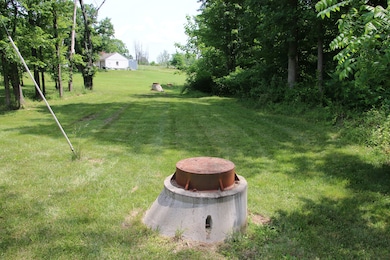
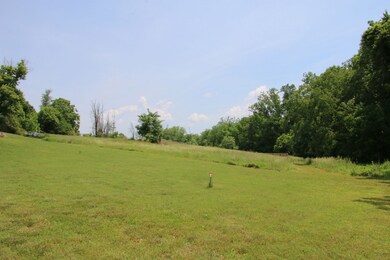
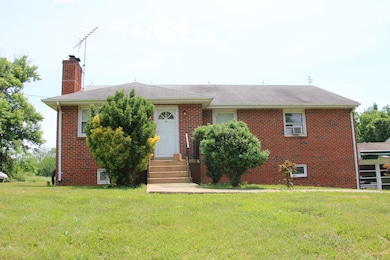
Opportunities await for the interested buyer looking to take advantage of over 30,000 passers-by that travel down this stretch of US Route 50 daily. With the current zoning in place of TR-2, you are allowed many more options than your typical residential property beside this heavily traveled road. One key factor this property provides is public sewer runs through the property, making for a much simpler and more affordable connection. Another great takeaway is the electric poles on the property already have service to accommodate a commercial facility or structure. A private well and septic system serve the residence currently on the property. Contact land Specialists Drew Baggarly and Chad Pangle today to schedule your showing.

Property Details
Property Type
- Land
Est. Annual Taxes
- $5,716
Lot Details
- Current uses include commercial
- Potential uses include for development
Map
Home Values in the Area
Average Home Value in this Area
Tax History
| Year | Tax Paid | Tax Assessment Tax Assessment Total Assessment is a certain percentage of the fair market value that is determined by local assessors to be the total taxable value of land and additions on the property. | Land | Improvement |
|---|---|---|---|---|
| 2025 | $5,716 | $710,040 | $368,600 | $341,440 |
| 2024 | $5,752 | $664,950 | $337,000 | $327,950 |
| 2023 | $5,069 | $579,320 | $273,600 | $305,720 |
| 2022 | $4,725 | $530,910 | $253,600 | $277,310 |
| 2021 | $4,108 | $419,150 | $188,300 | $230,850 |
| 2020 | $4,174 | $403,310 | $188,300 | $215,010 |
| 2019 | $4,161 | $398,170 | $188,300 | $209,870 |
| 2018 | $4,052 | $373,480 | $168,300 | $205,180 |
| 2017 | $3,937 | $349,990 | $168,300 | $181,690 |
| 2016 | $3,995 | $348,930 | $0 | $0 |
| 2015 | $3,967 | $181,240 | $0 | $181,240 |
| 2014 | $3,940 | $165,030 | $0 | $165,030 |
Property History
| Date | Event | Price | List to Sale | Price per Sq Ft |
|---|---|---|---|---|
| 09/08/2025 09/08/25 | Price Changed | $1,500,000 | -24.8% | $859 / Sq Ft |
| 06/09/2024 06/09/24 | Price Changed | $1,995,000 | -16.9% | $1,143 / Sq Ft |
| 04/03/2023 04/03/23 | For Sale | $2,400,000 | -- | $1,375 / Sq Ft |
- 41193 John Mosby Hwy
- 41170 Little River Turnpike
- 24067 Audubon Trail Dr
- 40747 Lenah Run Cir
- 24188 Spring Meadow Cir
- 41405 Gentle Wind Place
- 41381 Ladybug Ct
- 41424 Gentle Wind Place
- 41086 Freshfields Ct
- 23985 Tenbury Wells Place
- 40736 Witherspoon Ct
- 23751 Alton Ridge Place
- 23653 Horse Barn Ln
- 41490 Bedford Falls Ct
- 24224 Knollbrook Place
- 24596 Wateroak Place
- 23712 Safflower Ct
- 40925 Arcadian Pond Ct
- 24469 Island Pool Ct
- 23535 Parkside Village Cir
- 24188 Spring Meadow #1 Cir
- 24436 Lenah Rd
- 23646 Glenmallie Ct
- 40560 Aldie Springs Dr
- 24637 Woolly Mammoth Terrace Unit 303
- 41967 Pickwick Mill Terrace
- 24876 Helms Terrace
- 24525 Glenville Grove Terrace
- 24794 Serpentine Place
- 24626 Cable Mill Terrace
- 41953 Blue Flag Terrace
- 24911 Coats Square
- 42060 Fremont Preserve Square
- 24600 Siltstone Square
- 25146 Harpenden Terrace
- 41625 Broxbourne Terrace
- 41980 Ural Dr
- 24682 Lynette Springs Terrace
- 23659 Turtle Point Terrace
- 42235 San Juan Terrace Unit 303