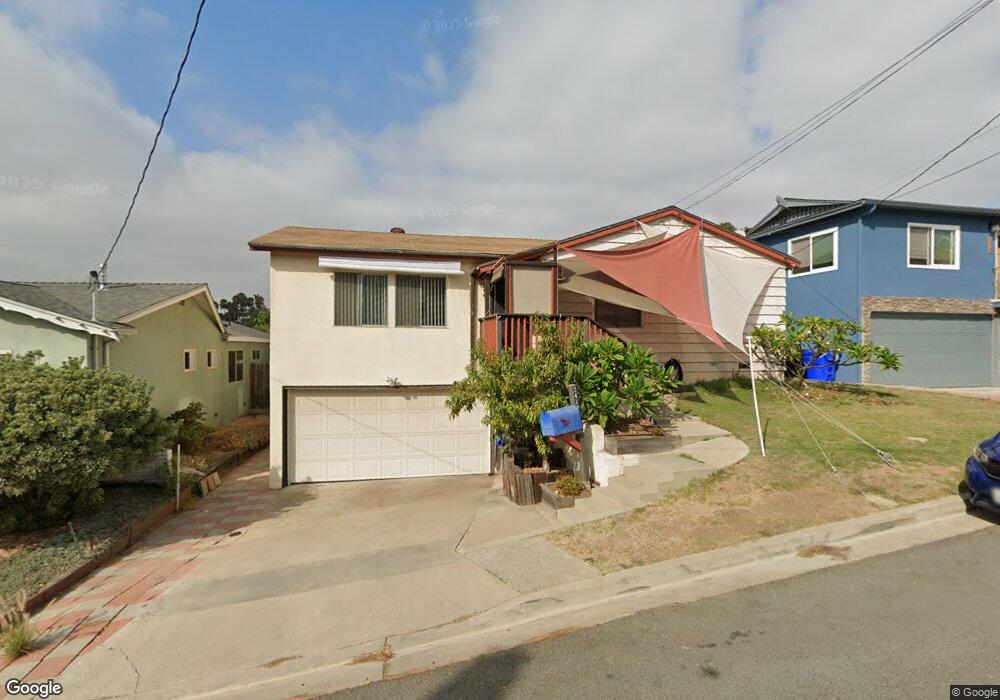
2412 34th St San Diego, CA 92104
North Park NeighborhoodEstimated Value: $1,161,500 - $1,538,000
3
Beds
2
Baths
1,610
Sq Ft
$812/Sq Ft
Est. Value
About This Home
This home is located at 2412 34th St, San Diego, CA 92104 and is currently estimated at $1,308,125, approximately $812 per square foot. 2412 34th St is a home located in San Diego County with nearby schools including McKinley Elementary School, Roosevelt International Middle School, and Mcgill School Of Success.
Ownership History
Date
Name
Owned For
Owner Type
Purchase Details
Closed on
May 12, 2021
Sold by
Liddell Timothy C and Liddell Linda C
Bought by
Liddell Tim C and Liddell Linda D
Current Estimated Value
Home Financials for this Owner
Home Financials are based on the most recent Mortgage that was taken out on this home.
Original Mortgage
$25,000
Outstanding Balance
$22,585
Interest Rate
2.9%
Mortgage Type
Credit Line Revolving
Estimated Equity
$1,285,540
Purchase Details
Closed on
Jan 12, 1996
Sold by
Berman Martin F and Berman Judith Diane
Bought by
Liddell Timothy C and Liddell Linda D
Home Financials for this Owner
Home Financials are based on the most recent Mortgage that was taken out on this home.
Original Mortgage
$133,385
Outstanding Balance
$3,561
Interest Rate
7.18%
Mortgage Type
FHA
Estimated Equity
$1,304,564
Purchase Details
Closed on
Sep 12, 1995
Sold by
Miller Frieda T and Berman Martin F
Bought by
Berman Martin F and Berman Judith Diane
Create a Home Valuation Report for This Property
The Home Valuation Report is an in-depth analysis detailing your home's value as well as a comparison with similar homes in the area
Home Values in the Area
Average Home Value in this Area
Purchase History
| Date | Buyer | Sale Price | Title Company |
|---|---|---|---|
| Liddell Tim C | -- | Accommodation | |
| Liddell Timothy C | $135,000 | First American Title Co | |
| Berman Martin F | $116,869 | -- |
Source: Public Records
Mortgage History
| Date | Status | Borrower | Loan Amount |
|---|---|---|---|
| Open | Liddell Tim C | $25,000 | |
| Open | Liddell Timothy C | $133,385 |
Source: Public Records
Tax History Compared to Growth
Tax History
| Year | Tax Paid | Tax Assessment Tax Assessment Total Assessment is a certain percentage of the fair market value that is determined by local assessors to be the total taxable value of land and additions on the property. | Land | Improvement |
|---|---|---|---|---|
| 2025 | $3,144 | $262,667 | $166,113 | $96,554 |
| 2024 | $3,144 | $257,517 | $162,856 | $94,661 |
| 2023 | $3,071 | $252,468 | $159,663 | $92,805 |
| 2022 | $2,987 | $247,519 | $156,533 | $90,986 |
| 2021 | $2,963 | $242,666 | $153,464 | $89,202 |
| 2020 | $2,927 | $240,179 | $151,891 | $88,288 |
| 2019 | $2,873 | $235,470 | $148,913 | $86,557 |
| 2018 | $2,687 | $230,854 | $145,994 | $84,860 |
| 2017 | $2,621 | $226,329 | $143,132 | $83,197 |
| 2016 | $2,577 | $221,892 | $140,326 | $81,566 |
| 2015 | $2,538 | $218,560 | $138,219 | $80,341 |
| 2014 | $2,497 | $214,280 | $135,512 | $78,768 |
Source: Public Records
Map
Nearby Homes
- 2280-82 Pentuckett Ave
- 2438 33rd St
- 2211 Bancroft St
- 2429 32nd St
- 2735-37 Teresita St
- 3606 Maple St Unit 12
- 3483 Olive St Unit 85
- 2609 Montclair St Unit 11
- 2170 Montclair St
- 2661 Montclair St
- 3440 Fir St
- 2685 Montclair St
- 2401 Capitan Ave
- 2475 Capitan Ave
- 2382 Haller St
- 2541 Haller St
- 2433 San Marcos Ave
- 2035 Haller St
- 2929 32nd St
- 3045-49 Juniper St