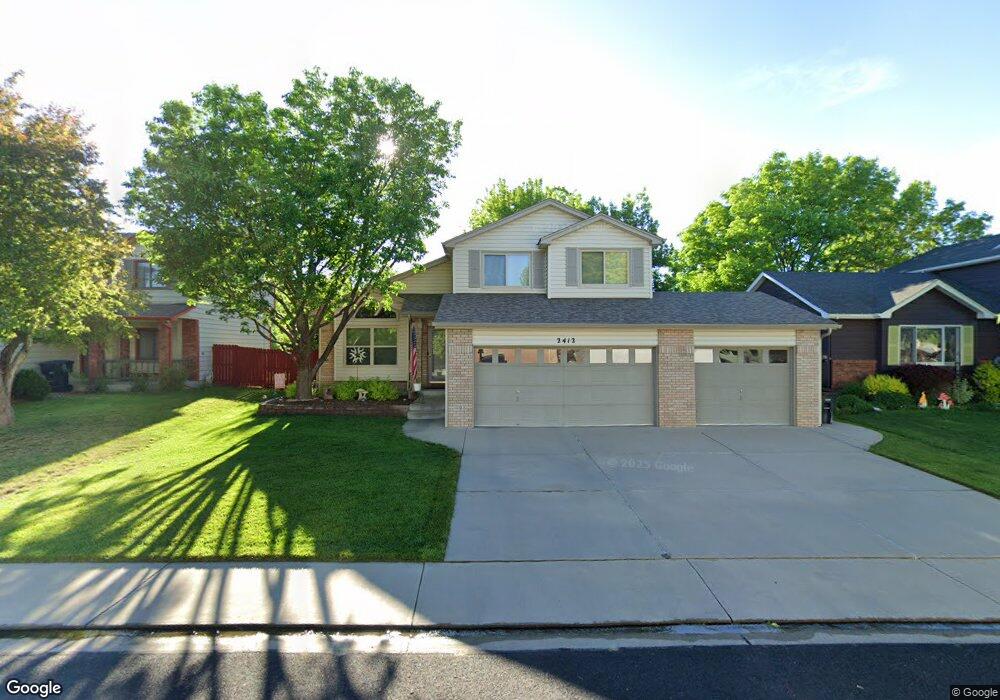
2412 Frontier St Longmont, CO 80501
Garden Acres NeighborhoodEstimated Value: $494,000 - $559,000
3
Beds
3
Baths
1,534
Sq Ft
$340/Sq Ft
Est. Value
About This Home
This home is located at 2412 Frontier St, Longmont, CO 80501 and is currently estimated at $522,257, approximately $340 per square foot. 2412 Frontier St is a home located in Boulder County with nearby schools including Sanborn Elementary School, Longs Peak Middle School, and Longmont High School.
Ownership History
Date
Name
Owned For
Owner Type
Purchase Details
Closed on
May 3, 2024
Sold by
Williams Karla K
Bought by
Karla Kristine Williams Living Trust and Williams
Current Estimated Value
Purchase Details
Closed on
Apr 19, 2014
Sold by
Williams Karla K and Wilson Karla K
Bought by
Williams Karla K
Purchase Details
Closed on
Nov 1, 2010
Sold by
Wilson Glenn E and Wilson Karla K
Bought by
Wilson Karla K
Purchase Details
Closed on
Jun 25, 1998
Sold by
Lynn Raasch William Robert and Lynn Janet
Bought by
Wilson Glenn E
Home Financials for this Owner
Home Financials are based on the most recent Mortgage that was taken out on this home.
Original Mortgage
$180,030
Interest Rate
7.09%
Mortgage Type
VA
Purchase Details
Closed on
Aug 1, 1995
Sold by
Raasch William Robert and Fraser Janet Lynn
Bought by
Raasch William Robert
Purchase Details
Closed on
Nov 4, 1992
Bought by
Williams Karla K
Purchase Details
Closed on
Jun 20, 1989
Bought by
Williams Karla K
Create a Home Valuation Report for This Property
The Home Valuation Report is an in-depth analysis detailing your home's value as well as a comparison with similar homes in the area
Home Values in the Area
Average Home Value in this Area
Purchase History
| Date | Buyer | Sale Price | Title Company |
|---|---|---|---|
| Karla Kristine Williams Living Trust | -- | None Listed On Document | |
| Williams Karla K | -- | None Available | |
| Wilson Karla K | -- | Servicelink | |
| Wilson Glenn E | $176,500 | First American Heritage Titl | |
| Raasch William Robert | -- | -- | |
| Williams Karla K | $118,400 | -- | |
| Williams Karla K | -- | -- |
Source: Public Records
Mortgage History
| Date | Status | Borrower | Loan Amount |
|---|---|---|---|
| Previous Owner | Wilson Glenn E | $180,030 |
Source: Public Records
Tax History Compared to Growth
Tax History
| Year | Tax Paid | Tax Assessment Tax Assessment Total Assessment is a certain percentage of the fair market value that is determined by local assessors to be the total taxable value of land and additions on the property. | Land | Improvement |
|---|---|---|---|---|
| 2025 | $3,026 | $32,369 | $5,338 | $27,031 |
| 2024 | $3,026 | $32,369 | $5,338 | $27,031 |
| 2023 | $2,984 | $31,631 | $5,990 | $29,326 |
| 2022 | $2,671 | $26,987 | $4,399 | $22,588 |
| 2021 | $2,705 | $27,764 | $4,526 | $23,238 |
| 2020 | $2,471 | $25,440 | $3,933 | $21,507 |
| 2019 | $2,432 | $25,440 | $3,933 | $21,507 |
| 2018 | $2,096 | $22,068 | $3,528 | $18,540 |
| 2017 | $2,068 | $24,397 | $3,900 | $20,497 |
| 2016 | $1,873 | $19,590 | $4,776 | $14,814 |
| 2015 | $1,784 | $15,857 | $5,015 | $10,842 |
| 2014 | $1,481 | $15,857 | $5,015 | $10,842 |
Source: Public Records
Map
Nearby Homes
- 2425 Spencer St
- 2456 Sunset Dr
- 2412 Sunset Dr
- 2191 Steele St
- 2124 Kay St
- 2108 Tulip St
- 2410 Maplewood Cir W
- 2421 Maplewood Cir W
- 2244 Vivian St
- 2425 Willow Ln
- 1512 Flemming Dr
- 1851 Trevor Cir
- 2634 Westlake Ct
- 1855 Trevor Cir
- 12788 Sheramdi St
- 2078 Goldfinch Ct
- 2339 Bowen St
- 2615 Falcon Dr
- 12682 Anhawa Ave
- 1736 Trevor Ct
- 2418 Frontier St
- 2406 Frontier St
- 2407 Sherri Mar St
- 2413 Sherri Mar St
- 2424 Frontier St
- 2400 Frontier St
- 2401 Sherri Mar St
- 2419 Sherri Mar St
- 2411 Frontier St
- 2417 Frontier St
- 2405 Frontier St
- 2337 Sherri Mar St
- 2430 Frontier St
- 2330 Frontier St
- 2423 Frontier St
- 2425 Sherri Mar St
- 2429 Frontier St
- 2331 Sherri Mar St
- 2100 24th Ave
- 2436 Frontier St