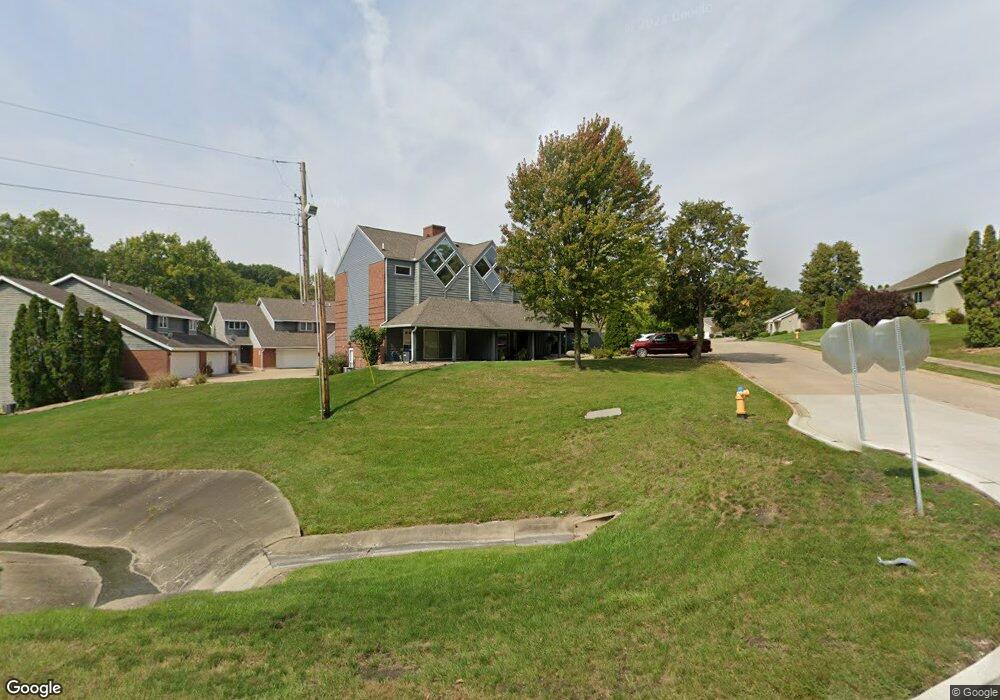
2413 Reynolds Manor Dr Unit 2 Ottawa, IL 61350
Estimated Value: $190,000 - $201,000
3
Beds
3
Baths
1,700
Sq Ft
$115/Sq Ft
Est. Value
About This Home
This home is located at 2413 Reynolds Manor Dr Unit 2, Ottawa, IL 61350 and is currently estimated at $196,000, approximately $115 per square foot. 2413 Reynolds Manor Dr Unit 2 is a home located in LaSalle County with nearby schools including Ottawa Township High School, Marquette Academy, and Marquette Elementary School.
Ownership History
Date
Name
Owned For
Owner Type
Purchase Details
Closed on
May 28, 2021
Sold by
Denton John Barry and Denton Family Revocable Trust
Bought by
Dougherty Brenda M
Current Estimated Value
Home Financials for this Owner
Home Financials are based on the most recent Mortgage that was taken out on this home.
Original Mortgage
$24,000
Outstanding Balance
$21,729
Interest Rate
2.9%
Mortgage Type
New Conventional
Estimated Equity
$174,271
Purchase Details
Closed on
Aug 30, 2011
Sold by
Denton John Barry and Denton Janet M
Bought by
Denton John Barry and Denton Janet M
Purchase Details
Closed on
Oct 27, 2005
Sold by
Republic Mortgage Inc Co
Bought by
Denton John B and Denton Janet M
Home Financials for this Owner
Home Financials are based on the most recent Mortgage that was taken out on this home.
Original Mortgage
$70,000
Interest Rate
5.8%
Mortgage Type
Unknown
Purchase Details
Closed on
Dec 17, 2004
Sold by
First Federal Saving Bank
Bought by
Republic Mortgage Insurance Co
Create a Home Valuation Report for This Property
The Home Valuation Report is an in-depth analysis detailing your home's value as well as a comparison with similar homes in the area
Home Values in the Area
Average Home Value in this Area
Purchase History
| Date | Buyer | Sale Price | Title Company |
|---|---|---|---|
| Dougherty Brenda M | $30,000 | None Available | |
| Denton John Barry | -- | None Available | |
| Denton John B | $110,000 | None Available | |
| Republic Mortgage Insurance Co | -- | None Available |
Source: Public Records
Mortgage History
| Date | Status | Borrower | Loan Amount |
|---|---|---|---|
| Open | Dougherty Brenda M | $24,000 | |
| Previous Owner | Denton John B | $70,000 |
Source: Public Records
Tax History Compared to Growth
Tax History
| Year | Tax Paid | Tax Assessment Tax Assessment Total Assessment is a certain percentage of the fair market value that is determined by local assessors to be the total taxable value of land and additions on the property. | Land | Improvement |
|---|---|---|---|---|
| 2024 | $4,678 | $51,419 | $1 | $51,418 |
| 2023 | $4,215 | $46,020 | $0 | $46,020 |
| 2022 | $3,819 | $41,768 | $0 | $41,768 |
| 2021 | $4,209 | $39,150 | $1 | $39,149 |
| 2020 | $3,978 | $37,190 | $1 | $37,189 |
| 2019 | $3,449 | $31,174 | $1 | $31,173 |
| 2018 | $3,393 | $30,426 | $1 | $30,425 |
| 2017 | $3,247 | $29,494 | $1 | $29,493 |
| 2016 | $3,120 | $28,229 | $1 | $28,228 |
| 2015 | $1,483 | $26,928 | $1 | $26,927 |
| 2012 | -- | $29,438 | $1 | $29,437 |
Source: Public Records
Map
Nearby Homes
- 000 Kain St
- 2125 Fox Chase Dr
- 2117 Fox Chase Dr Unit 2119
- 411 Deer Timber Ln
- 415 Deer Timber Ln
- 412 Deer Timber Ln
- 2707 Columbus St
- 216 Forest Park Place
- 2500 Beverly Way
- 6 Oaklane Dr
- 2103 Franklin Ave
- 2209 Berry Ave
- 1913 Columbus St
- 0000 Caleb Dr
- 1638 Timber Ln
- 1845 La Salle St
- 2011 Caton Rd
- 2520 Champlain St
- 213 Deleon St
- Lots 2 and 3 E Etna Rd
- 2415 Reynolds Manor Dr
- 2415 Reynolds Manor Dr Unit 1
- 2411 Reynolds Manor Dr
- 2411 Reynolds Manor Dr Unit 3
- 2407 Reynolds Manor Dr Unit 2
- 2407 Reynolds Manor Dr
- 2419 Reynolds Manor Dr
- 2417 Reynolds Manor Dr Unit 2
- 2417 Reynolds Manor Dr Unit 2417
- 2555 Reynolds Manor Dr
- 2551 Reynolds Manor Dr
- 2553 Reynolds Manor Dr
- 2427 Reynolds Manor Dr Unit 2
- 2425 Reynolds Manor Dr
- 2423 Reynolds Manor Dr Unit 2423
- 2421 Reynolds Manor Dr
- 2502 Reynolds Manor Dr
- 2504 Reynolds Manor Dr
- 2530 Reynolds Manor Dr
- 2503 Reynolds Manor Dr