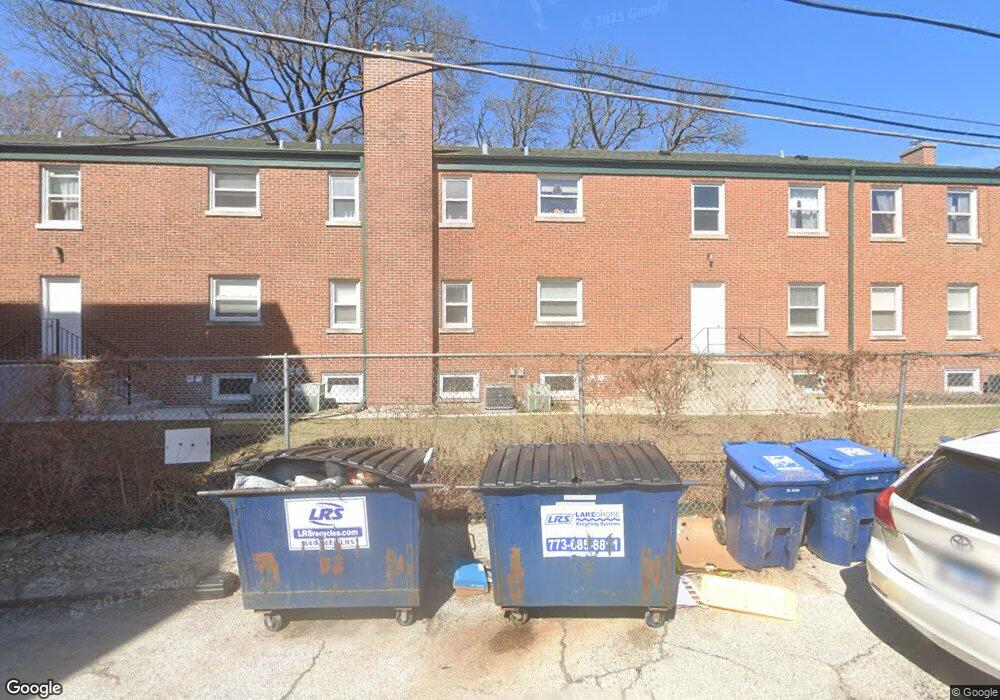
2413 W Estes Ave Unit 2 Chicago, IL 60645
West Ridge NeighborhoodEstimated Value: $161,590 - $174,000
2
Beds
1
Bath
800
Sq Ft
$212/Sq Ft
Est. Value
About This Home
This home is located at 2413 W Estes Ave Unit 2, Chicago, IL 60645 and is currently estimated at $169,898, approximately $212 per square foot. 2413 W Estes Ave Unit 2 is a home located in Cook County with nearby schools including Rogers Elementary School, Mather High School, and God's Battle Axe Prayer Academy.
Ownership History
Date
Name
Owned For
Owner Type
Purchase Details
Closed on
Dec 9, 2021
Sold by
Benjamin Kais and Estate Of Samir Benjamin
Bought by
Memon Mohammed Imran
Current Estimated Value
Home Financials for this Owner
Home Financials are based on the most recent Mortgage that was taken out on this home.
Original Mortgage
$114,300
Outstanding Balance
$105,322
Interest Rate
3.25%
Mortgage Type
New Conventional
Estimated Equity
$64,576
Purchase Details
Closed on
Sep 22, 2016
Sold by
Nagyfalusi Laszlo and Nagyfalusi Piroska
Bought by
Benjamin Samir
Purchase Details
Closed on
Oct 31, 2000
Sold by
Fitch Off The Park Ltd
Bought by
Nagyfalusi Laszlo
Home Financials for this Owner
Home Financials are based on the most recent Mortgage that was taken out on this home.
Original Mortgage
$122,400
Interest Rate
7.91%
Mortgage Type
Purchase Money Mortgage
Create a Home Valuation Report for This Property
The Home Valuation Report is an in-depth analysis detailing your home's value as well as a comparison with similar homes in the area
Home Values in the Area
Average Home Value in this Area
Purchase History
| Date | Buyer | Sale Price | Title Company |
|---|---|---|---|
| Memon Mohammed Imran | $127,000 | Saturn Title Llc | |
| Benjamin Samir | $95,000 | Chicago Title | |
| Nagyfalusi Laszlo | $132,500 | -- |
Source: Public Records
Mortgage History
| Date | Status | Borrower | Loan Amount |
|---|---|---|---|
| Open | Memon Mohammed Imran | $114,300 | |
| Previous Owner | Nagyfalusi Laszlo | $122,400 |
Source: Public Records
Tax History Compared to Growth
Tax History
| Year | Tax Paid | Tax Assessment Tax Assessment Total Assessment is a certain percentage of the fair market value that is determined by local assessors to be the total taxable value of land and additions on the property. | Land | Improvement |
|---|---|---|---|---|
| 2024 | $1,094 | $12,593 | $4,063 | $8,530 |
| 2023 | $1,748 | $8,500 | $3,251 | $5,249 |
| 2022 | $1,748 | $8,500 | $3,251 | $5,249 |
| 2021 | $1,039 | $8,499 | $3,250 | $5,249 |
| 2020 | $1,094 | $8,013 | $2,356 | $5,657 |
| 2019 | $1,109 | $8,949 | $2,356 | $6,593 |
| 2018 | $1,089 | $8,949 | $2,356 | $6,593 |
| 2017 | $176 | $4,193 | $2,112 | $2,081 |
| 2016 | $340 | $4,193 | $2,112 | $2,081 |
| 2015 | $288 | $4,193 | $2,112 | $2,081 |
| 2014 | $600 | $5,802 | $1,950 | $3,852 |
| 2013 | $633 | $6,108 | $1,950 | $4,158 |
Source: Public Records
Map
Nearby Homes
- 2424 W Estes Ave Unit 1C
- 2424 W Estes Ave Unit 3B
- 7129 N Oakley Ave
- 7249 N Campbell Ave Unit B
- 2224 W Touhy Ave Unit 3N
- 7223 N Oakley Ave Unit 1E
- 2416 W Morse Ave
- 2626 W Lunt Ave
- 2545 W Coyle Ave
- 2175 W Touhy Ave
- 6961 N Oakley Ave Unit 210
- 2650 W Touhy Ave
- 2509 W Morse Ave
- 7315 N Oakley Ave Unit 1A
- 2322 W Farwell Ave Unit 1W
- 2300 W Farwell Ave Unit 2
- 7234 N Hamilton Ave
- 2522 W Jarvis Ave
- 2325 W Farwell Ave Unit 2S
- 2101 W Greenleaf Ave
- 2417 W Fitch Ave Unit 2
- 2417 W Fitch Ave Unit 24172
- 2413 W Fitch Ave Unit 24131
- 2425 W Fitch Ave Unit 24252
- 2425 W Fitch Ave Unit 24251
- 2417 W Fitch Ave Unit 24171
- 2413 W Fitch Ave Unit 2
- 2417 W Fitch Ave Unit 1
- 2413 W Fitch Ave Unit 1
- 2419 W Fitch Ave Unit 1
- 2419 W Fitch Ave Unit 24191
- 2419 W Fitch Ave Unit 24192
- 2421 W Fitch Ave Unit 24211
- 2421 W Fitch Ave Unit 24212
- 2421 W Fitch Ave Unit 2
- 2421 W Fitch Ave Unit 1
- 2423 W Fitch Ave Unit 24231
- 2423 W Fitch Ave Unit 24232
- 2423 W Fitch Ave Unit 2
- 2427 W Fitch Ave Unit 24271