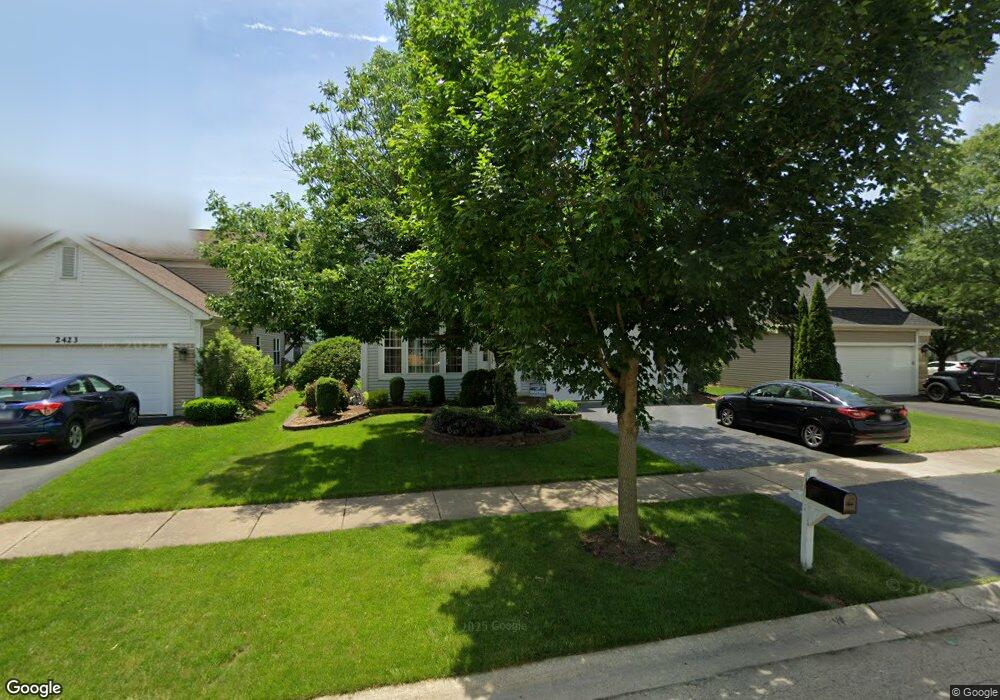
2415 Savoy Ct Aurora, IL 60503
Far Southeast NeighborhoodEstimated Value: $388,000 - $452,000
3
Beds
3
Baths
1,791
Sq Ft
$233/Sq Ft
Est. Value
About This Home
This home is located at 2415 Savoy Ct, Aurora, IL 60503 and is currently estimated at $418,177, approximately $233 per square foot. 2415 Savoy Ct is a home located in Will County with nearby schools including The Wheatlands Elementary School, Bednarcik Jr. High School, and Oswego East High School.
Ownership History
Date
Name
Owned For
Owner Type
Purchase Details
Closed on
Feb 22, 2017
Sold by
Murphy Scott and Murphy Rhonda
Bought by
Murphy Scott
Current Estimated Value
Purchase Details
Closed on
Oct 10, 2008
Sold by
Miller Kevin L and Miller Colleen M
Bought by
Murphy Scott and Murphy Rhonda
Home Financials for this Owner
Home Financials are based on the most recent Mortgage that was taken out on this home.
Original Mortgage
$204,000
Outstanding Balance
$132,424
Interest Rate
5.94%
Mortgage Type
Purchase Money Mortgage
Estimated Equity
$285,753
Purchase Details
Closed on
Oct 7, 1998
Sold by
Greenfield/Waterbury Llc
Bought by
Miller Kevin L and Miki Colleen M
Home Financials for this Owner
Home Financials are based on the most recent Mortgage that was taken out on this home.
Original Mortgage
$155,777
Interest Rate
6.59%
Mortgage Type
FHA
Create a Home Valuation Report for This Property
The Home Valuation Report is an in-depth analysis detailing your home's value as well as a comparison with similar homes in the area
Home Values in the Area
Average Home Value in this Area
Purchase History
| Date | Buyer | Sale Price | Title Company |
|---|---|---|---|
| Murphy Scott | -- | None Available | |
| Murphy Scott | $215,000 | Ticor | |
| Miller Kevin L | $164,500 | -- |
Source: Public Records
Mortgage History
| Date | Status | Borrower | Loan Amount |
|---|---|---|---|
| Open | Murphy Scott | $204,000 | |
| Previous Owner | Miller Kevin L | $155,777 |
Source: Public Records
Tax History Compared to Growth
Tax History
| Year | Tax Paid | Tax Assessment Tax Assessment Total Assessment is a certain percentage of the fair market value that is determined by local assessors to be the total taxable value of land and additions on the property. | Land | Improvement |
|---|---|---|---|---|
| 2024 | $8,879 | $109,862 | $30,881 | $78,981 |
| 2023 | $8,879 | $97,051 | $27,280 | $69,771 |
| 2022 | $8,234 | $88,744 | $25,805 | $62,939 |
| 2021 | $8,179 | $84,518 | $24,576 | $59,942 |
| 2020 | $7,828 | $83,179 | $24,187 | $58,992 |
| 2019 | $7,908 | $80,834 | $23,505 | $57,329 |
| 2018 | $7,310 | $72,814 | $22,988 | $49,826 |
| 2017 | $7,185 | $70,935 | $22,395 | $48,540 |
| 2016 | $7,199 | $69,408 | $21,913 | $47,495 |
| 2015 | $7,483 | $66,738 | $21,070 | $45,668 |
| 2014 | $7,483 | $64,340 | $21,070 | $43,270 |
| 2013 | $7,483 | $64,340 | $21,070 | $43,270 |
Source: Public Records
Map
Nearby Homes
- 2489 Rosehall Ln
- 2509 Rosehall Ln
- 2484 Warwick Ct
- 2632 Emma Cir
- 2538 Needham Ct
- 1722 Baler Ave
- 1728 Baler Ave
- 1716 Baler Ave
- 1734 Baler Ave
- 2730 Dorothy Dr Unit 1
- 2723 Rosehall Ln
- 1966 Congrove Dr
- 1629 Silver Springs Ct
- 1875 Keating Dr
- 1871 Keating Dr
- 1855 Keating Dr
- 2232 Daybreak Dr
- 2234 Daybreak Dr
- 2047 James Leigh Dr
- 2310 Twilight Dr
- 2423 Savoy Ct
- 2407 Savoy Ct
- 2431 Savoy Ct
- 2412 Albany Ct
- 2404 Albany Ct
- 2420 Albany Ct
- 2414 Savoy Ct
- 2439 Savoy Ct Unit 1A
- 2428 Albany Ct
- 2422 Savoy Ct
- 2406 Savoy Ct Unit 1A
- 2430 Savoy Ct
- 2460 Halsted Ln
- 2454 Halsted Ln
- 2398 Savoy Ct
- 2436 Albany Ct
- 2448 Halsted Ln
- 2438 Savoy Ct
- 2390 Savoy Ct
- 2447 Savoy Ct