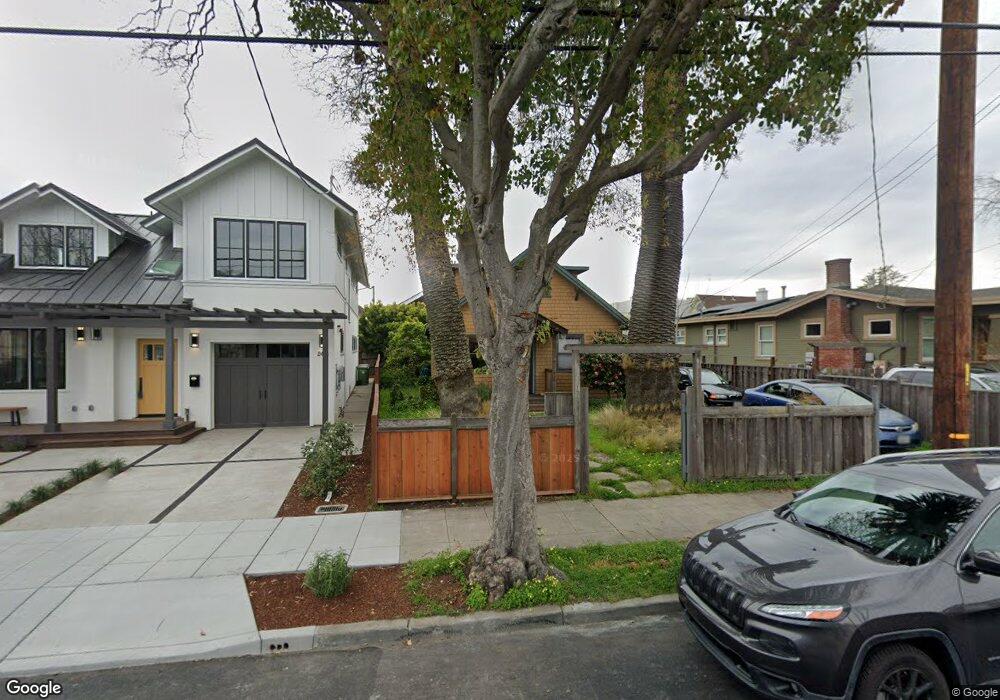
2416 Acton St Berkeley, CA 94702
West Berkeley NeighborhoodEstimated Value: $1,201,087 - $1,417,000
3
Beds
1
Bath
1,242
Sq Ft
$1,049/Sq Ft
Est. Value
About This Home
This home is located at 2416 Acton St, Berkeley, CA 94702 and is currently estimated at $1,303,022, approximately $1,049 per square foot. 2416 Acton St is a home located in Alameda County with nearby schools including Washington Elementary School, Oxford Elementary School, and Malcolm X Elementary School.
Ownership History
Date
Name
Owned For
Owner Type
Purchase Details
Closed on
Jun 16, 2014
Sold by
Lynman Richard T and Lyman Richard T
Bought by
Mayeri Daniel P and Papastephanou Katherine M
Current Estimated Value
Home Financials for this Owner
Home Financials are based on the most recent Mortgage that was taken out on this home.
Original Mortgage
$350,000
Outstanding Balance
$265,816
Interest Rate
4.16%
Mortgage Type
New Conventional
Estimated Equity
$1,037,206
Create a Home Valuation Report for This Property
The Home Valuation Report is an in-depth analysis detailing your home's value as well as a comparison with similar homes in the area
Home Values in the Area
Average Home Value in this Area
Purchase History
| Date | Buyer | Sale Price | Title Company |
|---|---|---|---|
| Mayeri Daniel P | $775,000 | Chicago Title Company |
Source: Public Records
Mortgage History
| Date | Status | Borrower | Loan Amount |
|---|---|---|---|
| Open | Mayeri Daniel P | $350,000 |
Source: Public Records
Tax History
| Year | Tax Paid | Tax Assessment Tax Assessment Total Assessment is a certain percentage of the fair market value that is determined by local assessors to be the total taxable value of land and additions on the property. | Land | Improvement |
|---|---|---|---|---|
| 2025 | $13,906 | $943,001 | $285,000 | $665,001 |
| 2024 | $13,906 | $924,378 | $279,413 | $651,965 |
| 2023 | $13,571 | $913,120 | $273,936 | $639,184 |
| 2022 | $13,297 | $888,217 | $268,565 | $626,652 |
| 2021 | $13,345 | $870,671 | $263,301 | $614,370 |
| 2020 | $12,743 | $868,673 | $260,602 | $608,071 |
| 2019 | $12,353 | $851,647 | $255,494 | $596,153 |
| 2018 | $12,153 | $834,953 | $250,486 | $584,467 |
| 2017 | $11,729 | $818,585 | $245,575 | $573,010 |
| 2016 | $11,413 | $802,535 | $240,760 | $561,775 |
| 2015 | $11,263 | $790,484 | $237,145 | $553,339 |
| 2014 | $2,390 | $59,958 | $37,677 | $22,281 |
Source: Public Records
Map
Nearby Homes
- 2350 Sacramento St
- 2324 Browning St
- 1142 Dwight Way
- 1118 Dwight Way
- 1515 Derby St
- 1612 Parker St
- 1645 Dwight Way
- 2231 Byron St
- 1612 Carleton St
- 1092 Dwight Way
- 1039 Channing Way
- 2750 Sacramento St
- 1450 Ward St
- 2144 Curtis St
- 2758 Sacramento St
- 2327 10th St Unit 4
- 2774 Sacramento St
- 2782 Sacramento St
- 2118 California St
- 2790 Sacramento St
Your Personal Tour Guide
Ask me questions while you tour the home.