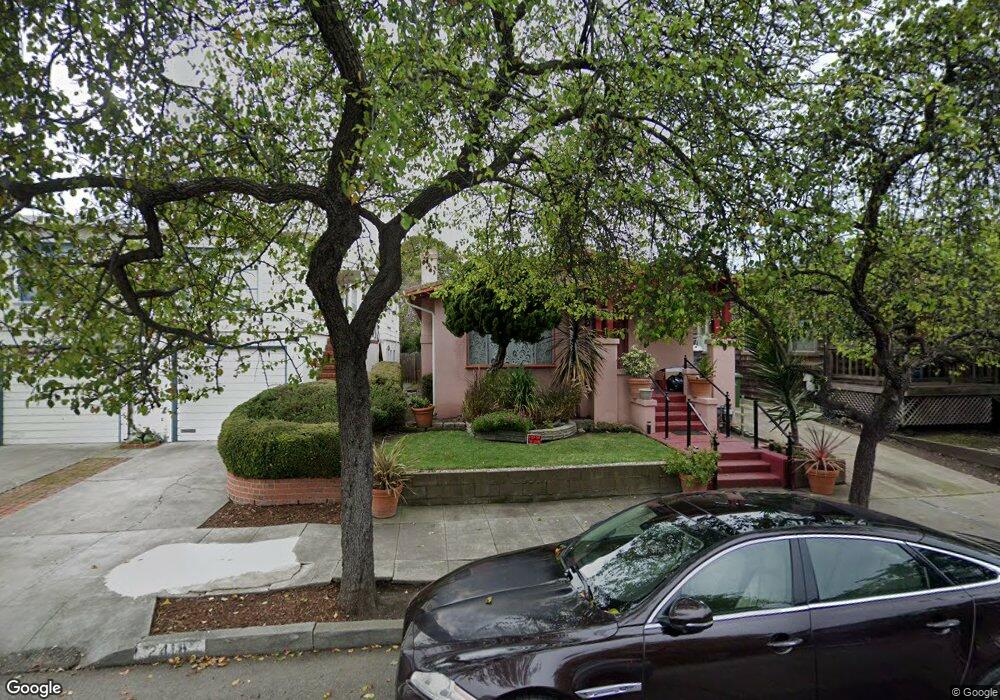
2416 Browning St Berkeley, CA 94702
West Berkeley NeighborhoodEstimated Value: $1,359,198 - $2,030,000
3
Beds
2
Baths
1,800
Sq Ft
$932/Sq Ft
Est. Value
About This Home
This home is located at 2416 Browning St, Berkeley, CA 94702 and is currently estimated at $1,678,050, approximately $932 per square foot. 2416 Browning St is a home located in Alameda County with nearby schools including Rosa Parks Elementary School, Ruth Acty Elementary, and Berkeley Arts Magnet at Whittier School.
Ownership History
Date
Name
Owned For
Owner Type
Purchase Details
Closed on
Jul 15, 2019
Sold by
Henderson Rhodney D and Henderson Sundra L
Bought by
Henderson Rhodney D and Henderson Sundra L
Current Estimated Value
Purchase Details
Closed on
Jul 12, 2016
Sold by
Hall Tereka
Bought by
Hines Melvin H
Home Financials for this Owner
Home Financials are based on the most recent Mortgage that was taken out on this home.
Original Mortgage
$600,000
Outstanding Balance
$480,213
Interest Rate
3.66%
Mortgage Type
New Conventional
Estimated Equity
$1,197,837
Purchase Details
Closed on
Feb 11, 2016
Sold by
Henderson Sundra L and Hines Melvin H
Bought by
Henderson Sundra L and Hines Melvin H
Purchase Details
Closed on
Dec 3, 2012
Sold by
Hines Melvin
Bought by
Hines Melvin
Home Financials for this Owner
Home Financials are based on the most recent Mortgage that was taken out on this home.
Original Mortgage
$645,000
Interest Rate
2.95%
Mortgage Type
Reverse Mortgage Home Equity Conversion Mortgage
Purchase Details
Closed on
Apr 4, 1996
Sold by
Hines Melvin and Hines Jody V
Bought by
Hines Melvin and Hines Jody V
Create a Home Valuation Report for This Property
The Home Valuation Report is an in-depth analysis detailing your home's value as well as a comparison with similar homes in the area
Home Values in the Area
Average Home Value in this Area
Purchase History
| Date | Buyer | Sale Price | Title Company |
|---|---|---|---|
| Henderson Rhodney D | -- | None Available | |
| Hines Melvin H | -- | Fidelity National Title Co | |
| Henderson Rhodney D | -- | Fidelity National Title Co | |
| Henderson Sundra L | -- | None Available | |
| Hines Melvin | -- | Placer Title Company | |
| Hines Melvin | -- | -- |
Source: Public Records
Mortgage History
| Date | Status | Borrower | Loan Amount |
|---|---|---|---|
| Open | Henderson Rhodney D | $600,000 | |
| Closed | Hines Melvin | $645,000 |
Source: Public Records
Tax History
| Year | Tax Paid | Tax Assessment Tax Assessment Total Assessment is a certain percentage of the fair market value that is determined by local assessors to be the total taxable value of land and additions on the property. | Land | Improvement |
|---|---|---|---|---|
| 2025 | $10,497 | $534,294 | $272,673 | $261,621 |
| 2024 | $10,497 | $523,820 | $267,328 | $256,492 |
| 2023 | $10,215 | $513,551 | $262,087 | $251,464 |
| 2022 | $10,157 | $503,481 | $256,948 | $246,533 |
| 2021 | $10,159 | $493,613 | $251,912 | $241,701 |
| 2020 | $9,592 | $488,552 | $249,329 | $239,223 |
| 2019 | $4,172 | $75,592 | $23,194 | $52,398 |
| 2018 | $4,036 | $74,110 | $22,739 | $51,371 |
| 2017 | $3,863 | $72,657 | $22,294 | $50,363 |
| 2016 | $3,606 | $71,232 | $21,856 | $49,376 |
| 2015 | $3,523 | $70,162 | $21,528 | $48,634 |
| 2014 | $3,429 | $68,788 | $21,106 | $47,682 |
Source: Public Records
Map
Nearby Homes
- 2324 Browning St
- 1144 Dwight Way
- 1142 Dwight Way
- 1118 Dwight Way
- 2231 Byron St
- 1039 Channing Way
- 2327 10th St Unit 4
- 1135 Parker St
- 1092 Dwight Way
- 2350 Sacramento St
- 2341 9th St
- 2241 Ninth St
- 1230 Addison St
- 931 Bancroft Way
- 917 Channing Way
- 2717 Mabel St
- 1604 Dwight Way
- 1919 Curtis St
- 2238 7th St
- 2411 Sixth St
- 2414 Browning St
- 2418 Browning St
- 2410 Browning St
- 2420 Browning St
- 2408 Browning St
- 2426 Browning St
- 2417 Curtis St
- 2415 Curtis St
- 2419 Curtis St
- 2421 Curtis St
- 2411 Curtis St
- 2428 Browning St
- 1216 Channing Way
- 2425 Curtis St
- 1212 Channing Way
- 1220 Channing Way
- 2417 Browning St
- 1208 Channing Way
- 2421 Browning St
- 2434 Browning St
Your Personal Tour Guide
Ask me questions while you tour the home.