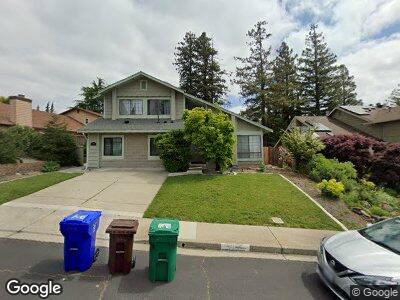
2416 Hill View Ln Pinole, CA 94564
Pinole Valley NeighborhoodEstimated Value: $746,000 - $966,000
3
Beds
3
Baths
1,944
Sq Ft
$452/Sq Ft
Est. Value
About This Home
This home is located at 2416 Hill View Ln, Pinole, CA 94564 and is currently estimated at $878,841, approximately $452 per square foot. 2416 Hill View Ln is a home located in Contra Costa County with nearby schools including Stewart Elementary School, Pinole Middle School, and Pinole Valley High School.
Ownership History
Date
Name
Owned For
Owner Type
Purchase Details
Closed on
Nov 5, 2019
Sold by
Win Nyan and Win Thu Khin
Bought by
Thapa Sarala and Kc Sulav
Current Estimated Value
Home Financials for this Owner
Home Financials are based on the most recent Mortgage that was taken out on this home.
Original Mortgage
$646,950
Interest Rate
3.6%
Mortgage Type
New Conventional
Purchase Details
Closed on
May 14, 2002
Sold by
Behjati Nancy A
Bought by
Win Nyan and Thu Khin Soe
Home Financials for this Owner
Home Financials are based on the most recent Mortgage that was taken out on this home.
Original Mortgage
$300,700
Interest Rate
6.94%
Mortgage Type
Purchase Money Mortgage
Create a Home Valuation Report for This Property
The Home Valuation Report is an in-depth analysis detailing your home's value as well as a comparison with similar homes in the area
Home Values in the Area
Average Home Value in this Area
Purchase History
| Date | Buyer | Sale Price | Title Company |
|---|---|---|---|
| Thapa Sarala | $681,000 | Old Republic Title Company | |
| Win Nyan | $446,000 | Fidelity National Title Co |
Source: Public Records
Mortgage History
| Date | Status | Borrower | Loan Amount |
|---|---|---|---|
| Open | Thapa Sarala | $646,500 | |
| Closed | Thapa Sarala | $646,950 | |
| Previous Owner | Win Nyan | $200,000 | |
| Previous Owner | Win Nyan | $235,000 | |
| Previous Owner | Win Nyan | $100,000 | |
| Previous Owner | Win Nyan | $322,700 | |
| Previous Owner | Win Nyan | $74,000 | |
| Previous Owner | Win Nyan | $300,700 | |
| Previous Owner | Behjati Nancy A | $182,000 | |
| Previous Owner | Behjati Nancy | $214,200 | |
| Closed | Win Nyan | $100,000 |
Source: Public Records
Tax History Compared to Growth
Tax History
| Year | Tax Paid | Tax Assessment Tax Assessment Total Assessment is a certain percentage of the fair market value that is determined by local assessors to be the total taxable value of land and additions on the property. | Land | Improvement |
|---|---|---|---|---|
| 2024 | $11,301 | $787,286 | $428,879 | $358,407 |
| 2023 | $10,287 | $715,850 | $420,470 | $295,380 |
| 2022 | $10,192 | $701,815 | $412,226 | $289,589 |
| 2021 | $10,173 | $688,055 | $404,144 | $283,911 |
| 2019 | $8,597 | $590,633 | $278,100 | $312,533 |
| 2018 | $8,317 | $579,053 | $272,648 | $306,405 |
| 2017 | $8,154 | $567,700 | $267,302 | $300,398 |
| 2016 | $7,565 | $515,000 | $242,489 | $272,511 |
| 2015 | $7,195 | $478,500 | $225,302 | $253,198 |
| 2014 | $6,761 | $440,500 | $207,410 | $233,090 |
Source: Public Records
Map
Nearby Homes
- 2940 Estates Ave Unit 6
- 2940 Estates Ave Unit 7
- 2930 Estates Ave Unit 5
- 2951 Estates Ave
- 188 Scotts Valley
- 2352 Ramona St
- 266 Scotts Valley
- 2525 Brandt Ct
- 2080 Sarah Dr
- 2326 Estrella Ct
- 1107 Tennent Ave
- 2086 Costa Ct
- 1114 Alta Marino Cir
- 2030 Sarah Dr
- 2210 Prune St
- 2501 Samuel St
- 102 S Wildwood
- 2157 Owens Ct
- 3134 Avis Way
- 118 Raven Ct
- 2416 Hill View Ln
- 2416 Hill View Ln Unit A
- 2416 Hill View Ln
- 2408 Hill View Ln
- 2424 Hill View Ln
- 2505 Faria Ct
- 2400 Hill View Ln
- 2501 Faria Ct
- 2432 Hill View Ln
- 2419 Hill View Ln
- 2407 Hill View Ln
- 2509 Faria Ct
- 2425 Hill View Ln
- 2440 Hill View Ln
- 2401 Hill View Ln
- 2431 Hill View Ln
- 2448 Hill View Ln
- 2437 Hill View Ln
- 3684 Ponderosa Trail
- 3676 Ponderosa Trail