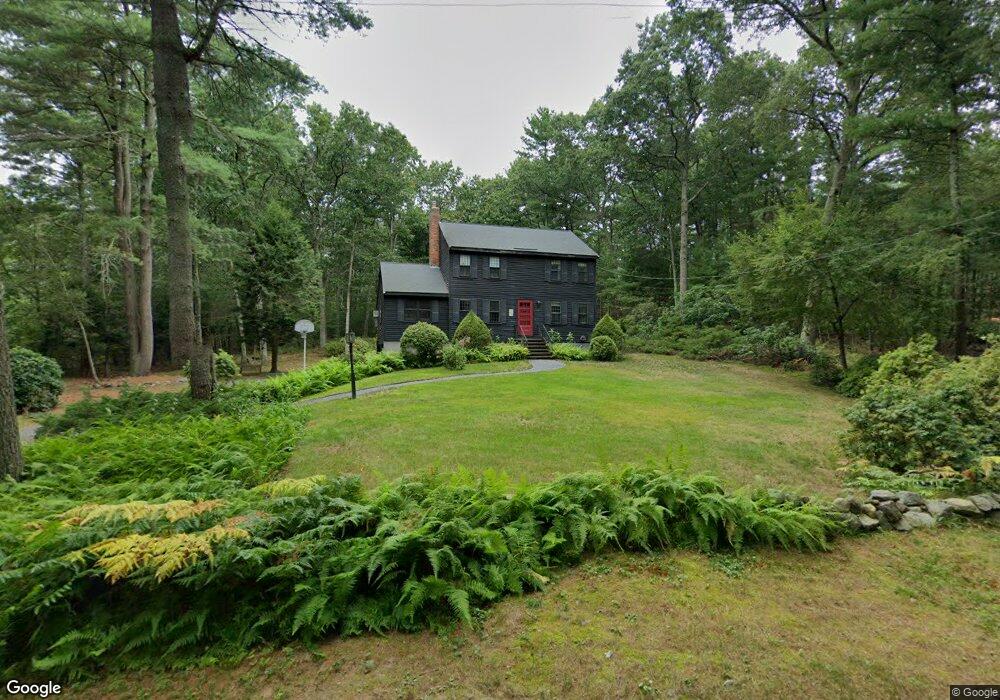
242 Lacy St North Andover, MA 01845
Estimated Value: $843,000 - $908,000
4
Beds
3
Baths
2,038
Sq Ft
$426/Sq Ft
Est. Value
About This Home
This home is located at 242 Lacy St, North Andover, MA 01845 and is currently estimated at $868,658, approximately $426 per square foot. 242 Lacy St is a home located in Essex County with nearby schools including Annie L Sargent Elementary School, North Andover Middle School, and North Andover High School.
Ownership History
Date
Name
Owned For
Owner Type
Purchase Details
Closed on
Apr 15, 2025
Sold by
Manteiga John A and Manteiga Anne C
Bought by
Kane Ryan T and Kane Dana
Current Estimated Value
Home Financials for this Owner
Home Financials are based on the most recent Mortgage that was taken out on this home.
Original Mortgage
$667,870
Outstanding Balance
$664,968
Interest Rate
6.76%
Mortgage Type
Purchase Money Mortgage
Estimated Equity
$203,690
Purchase Details
Closed on
Feb 16, 1990
Sold by
Roche Philip
Bought by
Manteiga John
Create a Home Valuation Report for This Property
The Home Valuation Report is an in-depth analysis detailing your home's value as well as a comparison with similar homes in the area
Home Values in the Area
Average Home Value in this Area
Purchase History
| Date | Buyer | Sale Price | Title Company |
|---|---|---|---|
| Kane Ryan T | $834,838 | None Available | |
| Kane Ryan T | $834,838 | None Available | |
| Manteiga John | $242,000 | -- | |
| Manteiga John | $242,000 | -- |
Source: Public Records
Mortgage History
| Date | Status | Borrower | Loan Amount |
|---|---|---|---|
| Open | Kane Ryan T | $667,870 | |
| Closed | Kane Ryan T | $667,870 | |
| Previous Owner | Manteiga John | $110,500 | |
| Previous Owner | Manteiga John | $120,500 | |
| Previous Owner | Manteiga John | $122,000 |
Source: Public Records
Tax History Compared to Growth
Tax History
| Year | Tax Paid | Tax Assessment Tax Assessment Total Assessment is a certain percentage of the fair market value that is determined by local assessors to be the total taxable value of land and additions on the property. | Land | Improvement |
|---|---|---|---|---|
| 2025 | $8,509 | $755,700 | $415,400 | $340,300 |
| 2024 | $8,018 | $723,000 | $393,600 | $329,400 |
| 2023 | $7,331 | $598,900 | $332,400 | $266,500 |
| 2022 | $7,183 | $530,900 | $301,900 | $229,000 |
| 2021 | $6,864 | $484,400 | $273,600 | $210,800 |
| 2020 | $6,656 | $484,400 | $273,600 | $210,800 |
| 2019 | $6,496 | $484,400 | $273,600 | $210,800 |
| 2018 | $7,038 | $484,400 | $273,600 | $210,800 |
| 2017 | $6,079 | $425,700 | $214,400 | $211,300 |
| 2016 | $5,798 | $406,300 | $213,100 | $193,200 |
| 2015 | $5,829 | $405,100 | $209,600 | $195,500 |
Source: Public Records
Map
Nearby Homes
- 851 Forest St
- 453 Forest St
- 42 Olympic Ln
- Lot 2 (31) Lawrence Rd
- 53 Lawrence Rd
- 660 Sharpners Pond Rd
- 2 Lawrence Rd
- 480 Sharpners Pond Rd
- 590 Foster St
- 39 Sheffield Rd
- 80 Compass Point Unit 80
- 66 Compass Point Unit 66
- 31 Herrick Rd
- 7 Sullivan St
- 10 High Ridge Rd
- 3 Harvest Dr Unit 106
- 3 Harvest Dr Unit 210
- 1 Harvest Dr Unit 205
- 26 Cross Rd
- 121 Cortland Dr