242 N Southampton Ave Columbus Grove, OH 45830
Valleyview Heights NeighborhoodEstimated Value: $186,000 - $249,000
6
Beds
2
Baths
2,460
Sq Ft
$90/Sq Ft
Est. Value
About This Home
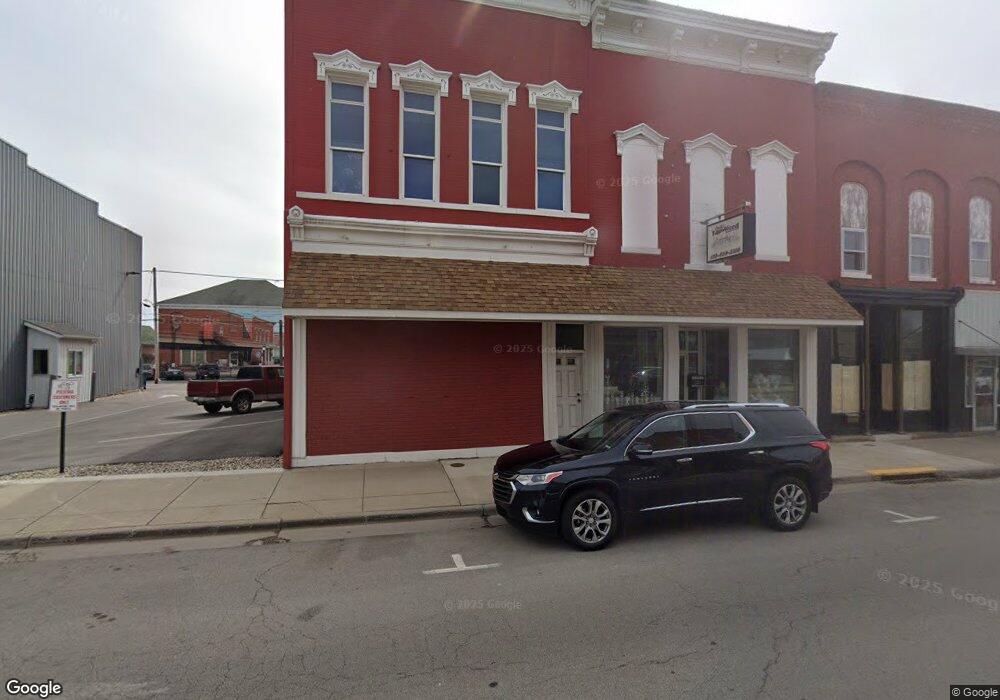
This home is located at 242 N Southampton Ave, Columbus Grove, OH 45830 and is currently estimated at $221,493, approximately $90 per square foot. 242 N Southampton Ave is a home with nearby schools including Valleyview Elementary School, Westmoor Middle School, and West High School.
Ownership History
Date
Name
Owned For
Owner Type
Purchase Details
Closed on
Dec 15, 2015
Sold by
Gebretensai Merhawi
Bought by
Gebretensai Rosina
Current Estimated Value
Purchase Details
Closed on
May 22, 2012
Sold by
Shahid Erin J
Bought by
Gebretensai Merchain and Gebretensai Rosina
Purchase Details
Closed on
Mar 9, 2012
Sold by
Ej Clearview & Associates Llc
Bought by
Shahid Erica J
Purchase Details
Closed on
Jan 31, 2008
Sold by
Shahid Erica J
Bought by
Ej Clearview & Associates Llc
Purchase Details
Closed on
Mar 6, 2007
Sold by
Shahid Erika J
Bought by
Ej Clearview & Associates Llc
Purchase Details
Closed on
Nov 29, 2005
Sold by
Columbus Metropolitan Housing Authority
Bought by
Shahid Erica J
Purchase Details
Closed on
Nov 5, 1970
Bought by
Columbus Metropolitan
Create a Home Valuation Report for This Property
The Home Valuation Report is an in-depth analysis detailing your home's value as well as a comparison with similar homes in the area
Home Values in the Area
Average Home Value in this Area
Purchase History
| Date | Buyer | Sale Price | Title Company |
|---|---|---|---|
| Gebretensai Rosina | $22,500 | Attorney | |
| Gebretensai Merchain | $40,000 | None Available | |
| Shahid Erica J | -- | Bxchicago Tit | |
| Ej Clearview & Associates Llc | -- | Fati | |
| Shahid Erica J | -- | Fati Box | |
| Ej Clearview & Associates Llc | -- | Attorney | |
| Shahid Erica J | -- | Preferred T | |
| Columbus Metropolitan | -- | -- |
Source: Public Records
Tax History Compared to Growth
Tax History
| Year | Tax Paid | Tax Assessment Tax Assessment Total Assessment is a certain percentage of the fair market value that is determined by local assessors to be the total taxable value of land and additions on the property. | Land | Improvement |
|---|---|---|---|---|
| 2024 | $3,184 | $69,480 | $8,400 | $61,080 |
| 2023 | $3,144 | $69,475 | $8,400 | $61,075 |
| 2022 | $1,855 | $34,900 | $8,050 | $26,850 |
| 2021 | $1,858 | $34,900 | $8,050 | $26,850 |
| 2020 | $2,102 | $34,900 | $8,050 | $26,850 |
| 2019 | $2,057 | $29,090 | $6,720 | $22,370 |
| 2018 | $1,956 | $29,090 | $6,720 | $22,370 |
| 2017 | $2,348 | $29,090 | $6,720 | $22,370 |
| 2016 | $2,482 | $15,750 | $4,270 | $11,480 |
| 2015 | $2,107 | $15,750 | $4,270 | $11,480 |
| 2014 | $977 | $15,750 | $4,270 | $11,480 |
| 2013 | $618 | $17,500 | $4,760 | $12,740 |
Source: Public Records
Map
Nearby Homes
- 160 N Sylvan Ave
- 355-357 N Algonquin Ave
- 3100 Steele Ave
- 66 N Brinker Ave
- 154-156 N Huron Ave
- 75 N Huron Ave
- 3096 Ellis Place
- 162 S Roys Ave
- 133 S Brinker Ave
- 65 N Chase Ave
- 195 S Sylvan Ave
- 527 N Hague Ave
- 227 S Sylvan Ave
- 664 N Wilson Rd
- 514 N Hague Ave
- 3307 Rudon Ln
- 253 Powhatan Ave
- 104-106 N Hague Ave
- 200-202 N Harris Ave
- 267 S Westgate Ave
- 242 N Southampton Ave
- 238 N Southampton Ave Unit 240
- 260 N Southampton Ave
- 234 N Southampton Ave Unit 236
- 270 N Southampton Ave
- 251 N Sylvan Ave
- 247 N Sylvan Ave
- 257 N Sylvan Ave
- 230 N Southampton Ave Unit 232
- 241 N Sylvan Ave
- 272 N Southampton Ave
- 263 N Sylvan Ave
- 0 N Sylvan Ave
- 222 N Southampton Ave
- 250 N Sylvan Ave
- 221 N Sylvan Ave
- 234 N Sylvan Ave
- 260 N Sylvan Ave
- 266 N Sylvan Ave
- 214 N Southampton Ave