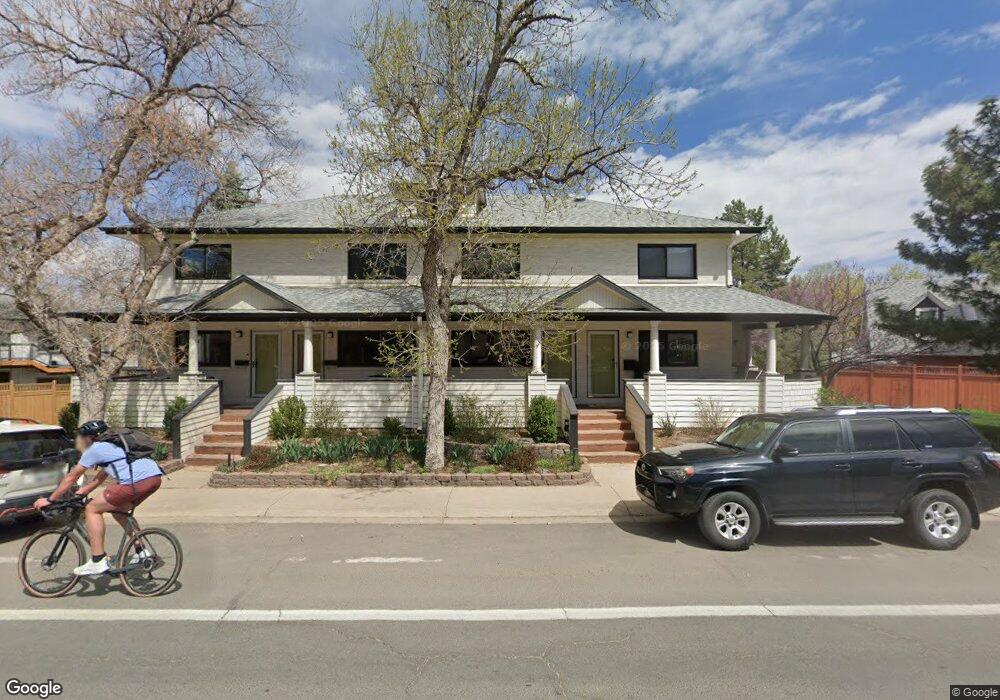
2420 9th St Unit 13 Boulder, CO 80304
Mapleton Hill NeighborhoodEstimated Value: $554,000 - $675,000
2
Beds
2
Baths
930
Sq Ft
$643/Sq Ft
Est. Value
About This Home
This home is located at 2420 9th St Unit 13, Boulder, CO 80304 and is currently estimated at $597,607, approximately $642 per square foot. 2420 9th St Unit 13 is a home located in Boulder County with nearby schools including Whittier Elementary School, Casey Middle School, and Boulder High School.
Ownership History
Date
Name
Owned For
Owner Type
Purchase Details
Closed on
May 29, 2003
Sold by
Conser Daniel and Conser Kathleen
Bought by
Conser Kathi
Current Estimated Value
Home Financials for this Owner
Home Financials are based on the most recent Mortgage that was taken out on this home.
Original Mortgage
$171,750
Outstanding Balance
$71,787
Interest Rate
5.15%
Mortgage Type
Purchase Money Mortgage
Estimated Equity
$525,820
Purchase Details
Closed on
Jan 10, 1996
Sold by
Borowsky Bruce M and Cortes Ana Maria
Bought by
Conser Daniel
Home Financials for this Owner
Home Financials are based on the most recent Mortgage that was taken out on this home.
Original Mortgage
$127,300
Interest Rate
7.31%
Mortgage Type
FHA
Purchase Details
Closed on
Jul 20, 1992
Bought by
Conser Kathi
Purchase Details
Closed on
Jul 29, 1988
Bought by
Conser Kathi
Purchase Details
Closed on
Jun 16, 1988
Bought by
Conser Kathi
Create a Home Valuation Report for This Property
The Home Valuation Report is an in-depth analysis detailing your home's value as well as a comparison with similar homes in the area
Home Values in the Area
Average Home Value in this Area
Purchase History
| Date | Buyer | Sale Price | Title Company |
|---|---|---|---|
| Conser Kathi | -- | Land Title Guarantee Company | |
| Conser Kathleen | -- | -- | |
| Conser Daniel | $132,000 | Commonwealth Land Title | |
| Conser Kathi | $83,000 | -- | |
| Conser Kathi | -- | -- | |
| Conser Kathi | -- | -- |
Source: Public Records
Mortgage History
| Date | Status | Borrower | Loan Amount |
|---|---|---|---|
| Open | Conser Kathi | $171,750 | |
| Closed | Conser Daniel | $127,300 |
Source: Public Records
Tax History
| Year | Tax Paid | Tax Assessment Tax Assessment Total Assessment is a certain percentage of the fair market value that is determined by local assessors to be the total taxable value of land and additions on the property. | Land | Improvement |
|---|---|---|---|---|
| 2025 | $3,454 | $39,188 | -- | $39,188 |
| 2024 | $3,454 | $39,188 | -- | $39,188 |
| 2023 | $3,392 | $38,406 | -- | $42,091 |
| 2022 | $3,649 | $38,489 | $0 | $38,489 |
| 2021 | $3,483 | $39,597 | $0 | $39,597 |
| 2020 | $3,352 | $38,503 | $0 | $38,503 |
| 2019 | $3,300 | $38,503 | $0 | $38,503 |
| 2018 | $2,749 | $31,709 | $0 | $31,709 |
| 2017 | $2,663 | $35,056 | $0 | $35,056 |
| 2016 | $2,205 | $25,472 | $0 | $25,472 |
| 2015 | $2,088 | $18,284 | $0 | $18,284 |
| 2014 | $1,537 | $18,284 | $0 | $18,284 |
Source: Public Records
Map
Nearby Homes
- 827 Maxwell Ave Unit E
- 1020 Portland Place
- 946 Portland Place
- 900 Portland Place
- 1009 Portland Place
- 1111 Maxwell Ave Unit 109
- 1111 Maxwell Ave Unit 105
- 1031 Portland Place Unit 4
- 643 Mapleton Ave
- 653 Dewey Ave
- 745 Highland Ave
- 604 Mapleton Ave
- 534 Dewey Ave
- 815 Alpine Ave Unit 2
- 934 Spruce St
- 613 Pine St
- 2449 5th St
- 2033 11th St Unit 3, 1
- 2409 5th St
- 515 Alpine Ave
- 2420 9th St Unit 1
- 2420 9th St Unit 16
- 2420 9th St Unit 15
- 2420 9th St Unit 14
- 2420 9th St Unit 12
- 2420 9th St Unit 11
- 2420 9th St
- 2420 9th St
- 2420 9th St Unit 5-legal 15
- 2420 9th St Unit 4
- 2420 9th St Unit 5
- 2420 9th St Unit 6
- 2444 9th St Unit 10
- 2444 9th St Unit 9
- 2444 9th St Unit 8
- 2444 9th St Unit 7
- 2444 9th St Unit 6
- 2444 9th St Unit 5
- 2444 9th St Unit 3
- 2444 9th St Unit 2
Your Personal Tour Guide
Ask me questions while you tour the home.