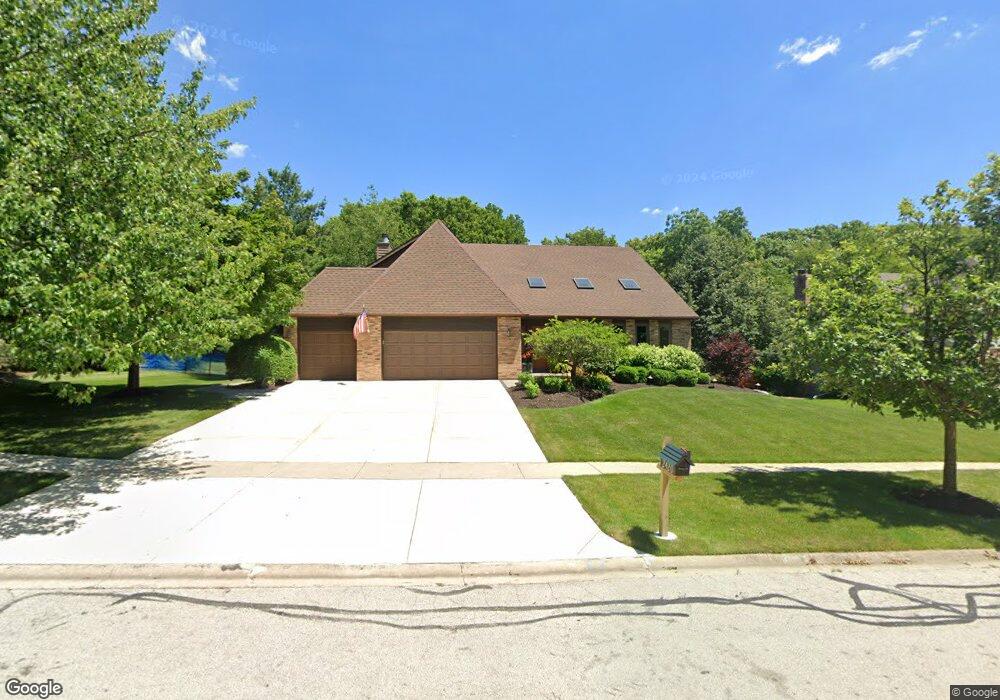
2420 Marshall Ct Naperville, IL 60565
Walnut Ridge NeighborhoodEstimated Value: $793,000 - $903,000
4
Beds
3
Baths
2,643
Sq Ft
$322/Sq Ft
Est. Value
About This Home
This home is located at 2420 Marshall Ct, Naperville, IL 60565 and is currently estimated at $851,072, approximately $322 per square foot. 2420 Marshall Ct is a home located in Will County with nearby schools including River Woods Elementary School, Madison Jr High School, and Naperville Central High School.
Ownership History
Date
Name
Owned For
Owner Type
Purchase Details
Closed on
Jun 21, 2025
Sold by
Larson Kevin L and Larson Deborah J
Bought by
Larson Kevin L and Larson Deborah J
Current Estimated Value
Purchase Details
Closed on
Mar 6, 2000
Sold by
Braswell Richard R and Braswell Marla C
Bought by
Larson Kevin L and Larson Deborah J
Home Financials for this Owner
Home Financials are based on the most recent Mortgage that was taken out on this home.
Original Mortgage
$252,600
Interest Rate
8.14%
Purchase Details
Closed on
Aug 6, 1997
Sold by
Leighton Wesley E and Leighton Sara E
Bought by
Braswell Richard R and Braswell Marla C
Home Financials for this Owner
Home Financials are based on the most recent Mortgage that was taken out on this home.
Original Mortgage
$269,800
Interest Rate
7.71%
Create a Home Valuation Report for This Property
The Home Valuation Report is an in-depth analysis detailing your home's value as well as a comparison with similar homes in the area
Home Values in the Area
Average Home Value in this Area
Purchase History
| Date | Buyer | Sale Price | Title Company |
|---|---|---|---|
| Larson Kevin L | -- | None Listed On Document | |
| Larson Kevin L | $437,000 | -- | |
| Braswell Richard R | $377,000 | -- |
Source: Public Records
Mortgage History
| Date | Status | Borrower | Loan Amount |
|---|---|---|---|
| Previous Owner | Larson Kevin L | $252,600 | |
| Previous Owner | Braswell Richard R | $269,800 |
Source: Public Records
Tax History
| Year | Tax Paid | Tax Assessment Tax Assessment Total Assessment is a certain percentage of the fair market value that is determined by local assessors to be the total taxable value of land and additions on the property. | Land | Improvement |
|---|---|---|---|---|
| 2024 | $15,050 | $241,265 | $73,747 | $167,518 |
| 2023 | $15,050 | $217,082 | $66,355 | $150,727 |
| 2022 | $12,945 | $194,189 | $59,822 | $134,367 |
| 2021 | $10,945 | $165,026 | $55,935 | $109,091 |
| 2020 | $11,109 | $168,000 | $56,943 | $111,057 |
| 2019 | $10,730 | $197,565 | $54,231 | $143,334 |
| 2018 | $12,743 | $189,094 | $51,906 | $137,188 |
| 2017 | $12,275 | $179,236 | $49,200 | $130,036 |
| 2016 | $12,507 | $179,600 | $49,300 | $130,300 |
| 2015 | $10,151 | $138,000 | $47,300 | $90,700 |
| 2014 | $10,151 | $138,000 | $47,300 | $90,700 |
| 2013 | $10,151 | $138,000 | $45,900 | $92,100 |
Source: Public Records
Map
Nearby Homes
- 2250 Lisson Rd
- 2408 Barkdoll Rd
- 2243 Aster Ct
- 2103 Primrose Ln
- 25 W 500 Royce Rd
- 1333 Purdue Ave
- 1406 River Oak Dr
- 460 Springwood Ln
- 4 Ridge Ct Unit 1
- 191 Cassin Rd
- 1909 Montclair Dr
- 561 Boardman Cir
- 845 Barclay Dr
- 1007 River Oak Dr
- 307 Leeds Ct
- 1042 Churchill Dr Unit 12
- VACANT W Boughton Rd
- 321 Carriage Hill Rd
- 44 Oak Bluff Ct
- 15 Pinnacle Ct
- 2416 Marshall Ct
- 2424 Marshall Ct
- 2412 Marshall Ct
- 2428 Marshall Ct
- 1129 Marshall Ct
- 2425 Madera Ln
- 1133 Marshall Ct
- 2433 Madera Ln
- 2417 Madera Ln
- 1137 Marshall Ct
- 1116 Colgate Ct Unit 3B
- 2409 Marshall Ct
- 2408 Marshall Ct
- 1141 Marshall Ct
- 1112 Colgate Ct
- 1117 Colgate Ct Unit 3B
- 2409 Madera Ln
- 2405 Marshall Ct Unit 3B
- 2441 Madera Ln
- 1113 Colgate Ct
Your Personal Tour Guide
Ask me questions while you tour the home.