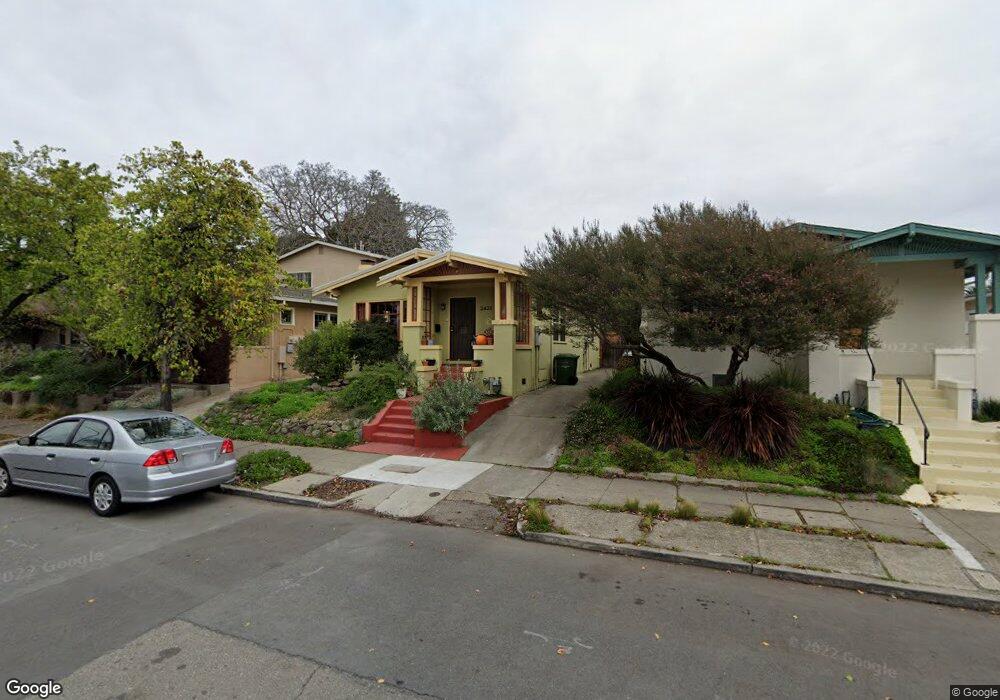
2421 Browning St Berkeley, CA 94702
West Berkeley NeighborhoodEstimated Value: $1,086,515 - $1,230,000
3
Beds
1
Bath
1,079
Sq Ft
$1,078/Sq Ft
Est. Value
About This Home
This home is located at 2421 Browning St, Berkeley, CA 94702 and is currently estimated at $1,163,129, approximately $1,077 per square foot. 2421 Browning St is a home located in Alameda County with nearby schools including Rosa Parks Elementary School, Ruth Acty Elementary, and Berkeley Arts Magnet at Whittier School.
Ownership History
Date
Name
Owned For
Owner Type
Purchase Details
Closed on
Jan 29, 2010
Sold by
Hill Hattie Marie
Bought by
Sheridan Jonah Silas and Futamura Yuri
Current Estimated Value
Home Financials for this Owner
Home Financials are based on the most recent Mortgage that was taken out on this home.
Original Mortgage
$332,000
Outstanding Balance
$219,728
Interest Rate
5.03%
Mortgage Type
New Conventional
Estimated Equity
$943,401
Purchase Details
Closed on
May 5, 2000
Sold by
Hill Dave
Bought by
Hill Hattie Marie
Home Financials for this Owner
Home Financials are based on the most recent Mortgage that was taken out on this home.
Original Mortgage
$85,000
Interest Rate
8.22%
Mortgage Type
Stand Alone First
Create a Home Valuation Report for This Property
The Home Valuation Report is an in-depth analysis detailing your home's value as well as a comparison with similar homes in the area
Home Values in the Area
Average Home Value in this Area
Purchase History
| Date | Buyer | Sale Price | Title Company |
|---|---|---|---|
| Sheridan Jonah Silas | $415,000 | Old Republic Title Company | |
| Hill Hattie Marie | -- | New Century Title Company |
Source: Public Records
Mortgage History
| Date | Status | Borrower | Loan Amount |
|---|---|---|---|
| Open | Sheridan Jonah Silas | $332,000 | |
| Previous Owner | Hill Hattie Marie | $85,000 |
Source: Public Records
Tax History
| Year | Tax Paid | Tax Assessment Tax Assessment Total Assessment is a certain percentage of the fair market value that is determined by local assessors to be the total taxable value of land and additions on the property. | Land | Improvement |
|---|---|---|---|---|
| 2025 | $8,454 | $528,652 | $160,695 | $374,957 |
| 2024 | $8,454 | $518,153 | $157,546 | $367,607 |
| 2023 | $8,274 | $514,857 | $154,457 | $360,400 |
| 2022 | $8,118 | $497,764 | $151,429 | $353,335 |
| 2021 | $8,129 | $487,870 | $148,461 | $346,409 |
| 2020 | $7,688 | $489,798 | $146,939 | $342,859 |
| 2019 | $7,377 | $480,195 | $144,058 | $336,137 |
| 2018 | $7,248 | $470,784 | $141,235 | $329,549 |
| 2017 | $6,976 | $461,554 | $138,466 | $323,088 |
| 2016 | $6,743 | $452,507 | $135,752 | $316,755 |
| 2015 | $6,651 | $445,713 | $133,714 | $311,999 |
| 2014 | $6,601 | $436,986 | $131,096 | $305,890 |
Source: Public Records
Map
Nearby Homes
- 2324 Browning St
- 1144 Dwight Way
- 1142 Dwight Way
- 1118 Dwight Way
- 2231 Byron St
- 1039 Channing Way
- 2327 10th St Unit 4
- 1135 Parker St
- 1092 Dwight Way
- 2350 Sacramento St
- 2341 9th St
- 2241 Ninth St
- 1230 Addison St
- 931 Bancroft Way
- 917 Channing Way
- 2717 Mabel St
- 1604 Dwight Way
- 1919 Curtis St
- 2238 7th St
- 2411 Sixth St
- 2423 Browning St
- 2417 Browning St
- 2427 Browning St
- 2413 Browning St
- 2431 Browning St
- 2422 Bonar St
- 2420 Bonar St
- 2424 Bonar St
- 2409 Browning St
- 2418 Bonar St
- 2428 Bonar St
- 2433 Browning St
- 2416 Bonar St
- 2430 Bonar St
- 2418 Browning St
- 2420 Browning St
- 2416 Browning St
- 2435 Browning St
- 2432 Bonar St
- 2414 Browning St
Your Personal Tour Guide
Ask me questions while you tour the home.