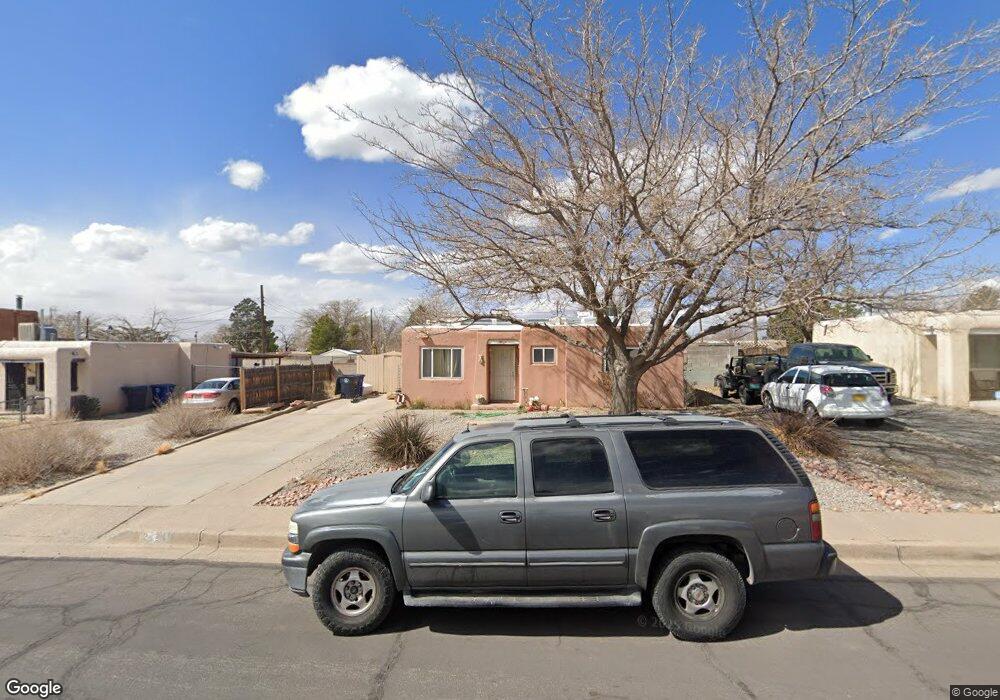
2421 Elizabeth St NE Albuquerque, NM 87112
Northeast Heights NeighborhoodEstimated Value: $224,000 - $256,000
2
Beds
1
Bath
846
Sq Ft
$290/Sq Ft
Est. Value
About This Home
This home is located at 2421 Elizabeth St NE, Albuquerque, NM 87112 and is currently estimated at $245,432, approximately $290 per square foot. 2421 Elizabeth St NE is a home located in Bernalillo County with nearby schools including Eldorado High School, Matheson Park Elementary School, and Hoover Middle School.
Ownership History
Date
Name
Owned For
Owner Type
Purchase Details
Closed on
Sep 22, 2006
Sold by
Heartfelt Homes Llc
Bought by
Lindenmuth Shirley J
Current Estimated Value
Home Financials for this Owner
Home Financials are based on the most recent Mortgage that was taken out on this home.
Original Mortgage
$136,000
Outstanding Balance
$81,138
Interest Rate
6.55%
Mortgage Type
Purchase Money Mortgage
Estimated Equity
$164,294
Purchase Details
Closed on
Apr 27, 2006
Sold by
Garcia John Joseph and Garcia Anna I
Bought by
Heartfelt Homes Llc
Purchase Details
Closed on
Jun 8, 2004
Sold by
Reeves Anna I
Bought by
Garcia John Joseph and Garcia Anna I
Purchase Details
Closed on
May 25, 2000
Sold by
Ruiz Micheal A and Ruiz Pamela M
Bought by
Reeves Anna I
Home Financials for this Owner
Home Financials are based on the most recent Mortgage that was taken out on this home.
Original Mortgage
$88,428
Interest Rate
8.17%
Mortgage Type
FHA
Create a Home Valuation Report for This Property
The Home Valuation Report is an in-depth analysis detailing your home's value as well as a comparison with similar homes in the area
Home Values in the Area
Average Home Value in this Area
Purchase History
| Date | Buyer | Sale Price | Title Company |
|---|---|---|---|
| Lindenmuth Shirley J | -- | Fntc | |
| Heartfelt Homes Llc | -- | Fidelity Natl Title Ins Co | |
| Garcia John Joseph | -- | Fidelity Natl Title Ins Co | |
| Reeves Anna I | -- | Rio Grande Title Company Inc |
Source: Public Records
Mortgage History
| Date | Status | Borrower | Loan Amount |
|---|---|---|---|
| Open | Lindenmuth Shirley J | $136,000 | |
| Previous Owner | Reeves Anna I | $88,428 |
Source: Public Records
Tax History Compared to Growth
Tax History
| Year | Tax Paid | Tax Assessment Tax Assessment Total Assessment is a certain percentage of the fair market value that is determined by local assessors to be the total taxable value of land and additions on the property. | Land | Improvement |
|---|---|---|---|---|
| 2025 | $1,663 | $40,601 | $12,767 | $27,834 |
| 2024 | $1,663 | $39,419 | $12,396 | $27,023 |
| 2023 | $1,635 | $38,271 | $12,035 | $26,236 |
| 2022 | $1,580 | $37,156 | $11,684 | $25,472 |
| 2021 | $1,527 | $36,075 | $11,344 | $24,731 |
| 2020 | $1,502 | $35,024 | $11,014 | $24,010 |
| 2019 | $1,458 | $34,004 | $10,693 | $23,311 |
| 2018 | $1,406 | $34,004 | $10,693 | $23,311 |
| 2017 | $1,363 | $33,014 | $10,382 | $22,632 |
| 2016 | $1,324 | $31,119 | $9,786 | $21,333 |
| 2015 | $30,213 | $30,213 | $9,501 | $20,712 |
| 2014 | $1,246 | $29,334 | $9,225 | $20,109 |
| 2013 | -- | $28,479 | $8,956 | $19,523 |
Source: Public Records
Map
Nearby Homes
- 2417 Britt St NE
- 2329 Britt St NE
- 10410 Towner Ave NE
- 10708 Lexington Ave NE
- 2905 Dorothy St NE
- 2904 June St NE
- 2805 Christine St NE
- 3110 Betts Dr NE
- 2700 Eubank Blvd NE
- 3125 Lori Place NE
- 1833 Britt St NE
- 9521 Salem Rd NE
- 1801 June St NE
- 1800 Pitt St NE
- 9916 Toltec Rd NE
- 1812 Mary Ellen St NE
- 11600 Snowheights Blvd NE
- 11008 Morris Ct NE
- 11815 Apache Ave NE
- 32 Lakeshore Dr NE
- 2421 Elizabeth St NE Unit 1
- 2425 Elizabeth St NE
- 2417 Elizabeth St NE
- 2413 Elizabeth St NE
- 2429 Elizabeth St NE
- 2416 Elizabeth St NE
- 2420 Elizabeth St NE
- 2424 Elizabeth St NE
- 2409 Elizabeth St NE
- 2433 Elizabeth St NE
- 2412 Elizabeth St NE
- 2424 Britt St NE
- 2428 Elizabeth St NE
- 2420 Britt St NE
- 2416 Britt St NE
- 2408 Elizabeth St NE
- 2428 Britt St NE
- 2412 Britt St NE
- 2405 Elizabeth St NE
- 2417 Morris St NE