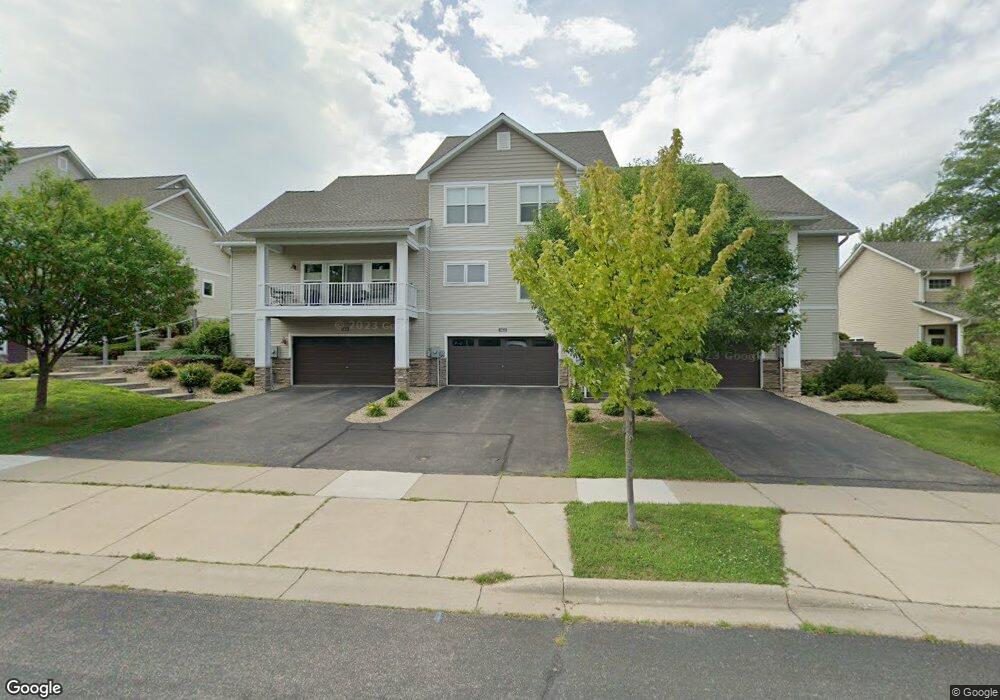
2422 Elianna Dr Northfield, MN 55057
Estimated Value: $334,000 - $350,457
3
Beds
3
Baths
2,460
Sq Ft
$138/Sq Ft
Est. Value
About This Home
This home is located at 2422 Elianna Dr, Northfield, MN 55057 and is currently estimated at $339,864, approximately $138 per square foot. 2422 Elianna Dr is a home located in Rice County with nearby schools including Spring Creek Elementary, Northfield Middle School, and Northfield Senior High School.
Ownership History
Date
Name
Owned For
Owner Type
Purchase Details
Closed on
Sep 15, 2022
Sold by
Rose Michael A and Rose Kassandra L
Bought by
Nelson Jennifer
Current Estimated Value
Home Financials for this Owner
Home Financials are based on the most recent Mortgage that was taken out on this home.
Original Mortgage
$232,000
Outstanding Balance
$221,179
Interest Rate
4.99%
Mortgage Type
New Conventional
Estimated Equity
$118,685
Purchase Details
Closed on
Jul 6, 2020
Sold by
Nielson Kassandra L and Rose Michael A
Bought by
Nielson Jacob R and Rose Michael A
Purchase Details
Closed on
Feb 17, 2017
Sold by
Underdahl Dale Dale
Bought by
Nielson Kassandra
Home Financials for this Owner
Home Financials are based on the most recent Mortgage that was taken out on this home.
Original Mortgage
$186,400
Interest Rate
4.09%
Mortgage Type
New Conventional
Purchase Details
Closed on
May 16, 2006
Sold by
Fargaze Meadows Townhomes Llc
Bought by
Underdahl Dale and Underdahl Lynette
Create a Home Valuation Report for This Property
The Home Valuation Report is an in-depth analysis detailing your home's value as well as a comparison with similar homes in the area
Home Values in the Area
Average Home Value in this Area
Purchase History
| Date | Buyer | Sale Price | Title Company |
|---|---|---|---|
| Nelson Jennifer | $290,000 | -- | |
| Nielson Jacob R | -- | None Available | |
| Nielson Kassandra | $233,000 | -- | |
| Nielson Kassandra | $233,000 | Attorney | |
| Underdahl Dale | $267,829 | -- |
Source: Public Records
Mortgage History
| Date | Status | Borrower | Loan Amount |
|---|---|---|---|
| Open | Nelson Jennifer | $232,000 | |
| Previous Owner | Nielson Kassandra | $186,400 |
Source: Public Records
Tax History Compared to Growth
Tax History
| Year | Tax Paid | Tax Assessment Tax Assessment Total Assessment is a certain percentage of the fair market value that is determined by local assessors to be the total taxable value of land and additions on the property. | Land | Improvement |
|---|---|---|---|---|
| 2025 | $5,648 | $331,100 | $39,500 | $291,600 |
| 2024 | $5,648 | $312,100 | $31,000 | $281,100 |
| 2023 | $4,562 | $312,100 | $31,000 | $281,100 |
| 2022 | $3,978 | $290,300 | $31,000 | $259,300 |
| 2021 | $3,892 | $249,000 | $30,000 | $219,000 |
| 2020 | $3,782 | $240,800 | $32,500 | $208,300 |
| 2019 | $3,468 | $230,000 | $32,500 | $197,500 |
| 2018 | $3,322 | $210,100 | $32,500 | $177,600 |
| 2017 | $2,902 | $198,900 | $27,500 | $171,400 |
| 2016 | $2,676 | $190,300 | $27,500 | $162,800 |
| 2015 | $2,606 | $169,800 | $27,500 | $142,300 |
| 2014 | -- | $166,700 | $25,000 | $141,700 |
Source: Public Records
Map
Nearby Homes
- 2414 Elianna Dr
- 2401 Elianna Dr
- 623 Ford St E
- 535 Southbridge Dr
- 422 Ford St E
- 2508 Country View Dr
- 820 Superior Dr
- 425 Ford St E
- 421 Ford St E
- 414 Ford St E
- 406 Ford St E
- 402 Ford St E
- 318 Ford St E
- 1907 Red Maple Ln
- 708 Maple Place
- 712 Maple Place
- 2015 Erie Dr
- 1806 Prairie St
- 2019 Erie Dr
- 1907 Erie Dr
- 2418 Elianna Dr
- 2426 Elianna Dr
- 2430 Elianna Dr
- 2410 Elianna Dr
- 2434 Elianna Dr
- 2438 Elianna Dr
- 2402 Elianna Dr
- 2442 Elianna Dr
- 2409 Elianna Dr
- 2413 Elianna Dr
- 2413 2413 Elianna Dr
- 2405 Elianna Dr
- 622 Southbridge Dr
- 2346 Elianna Dr
- 2446 Elianna Dr
- 2417 Elianna Dr
- 618 Southbridge Dr
- 2342 Elianna Dr
- 2450 Elianna Dr
- 614 Southbridge Dr