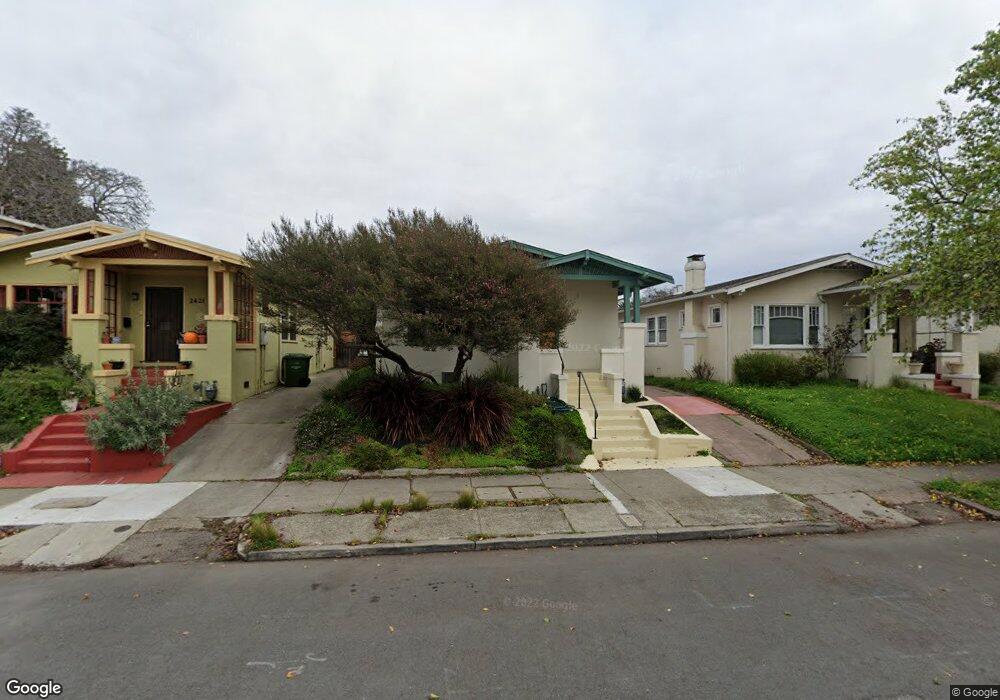
2423 Browning St Berkeley, CA 94702
West Berkeley NeighborhoodEstimated Value: $874,000 - $1,088,000
2
Beds
1
Bath
949
Sq Ft
$1,029/Sq Ft
Est. Value
About This Home
This home is located at 2423 Browning St, Berkeley, CA 94702 and is currently estimated at $976,718, approximately $1,029 per square foot. 2423 Browning St is a home located in Alameda County with nearby schools including Rosa Parks Elementary School, Ruth Acty Elementary, and Berkeley Arts Magnet at Whittier School.
Ownership History
Date
Name
Owned For
Owner Type
Purchase Details
Closed on
Oct 17, 2013
Sold by
Strawn Charles William and Siegel Eve Linda
Bought by
Strawn Charles William and Siegel Eve Linda
Current Estimated Value
Purchase Details
Closed on
Apr 30, 2013
Sold by
Strawn Charles William and Siegel Eve Linda
Bought by
Strawn Charles William and Siegel Eve Linda
Purchase Details
Closed on
Sep 2, 2000
Sold by
Strawn C W and Siegel Eve L
Bought by
Strawn Charles William and Siegel Eve Linda
Purchase Details
Closed on
Aug 25, 2000
Sold by
Laurie Lane
Bought by
Lane Jesse
Create a Home Valuation Report for This Property
The Home Valuation Report is an in-depth analysis detailing your home's value as well as a comparison with similar homes in the area
Home Values in the Area
Average Home Value in this Area
Purchase History
| Date | Buyer | Sale Price | Title Company |
|---|---|---|---|
| Strawn Charles William | -- | None Available | |
| Strawn Charles William | -- | None Available | |
| Strawn Charles William | -- | -- | |
| Lane Jesse | -- | -- | |
| Lane Jesse | -- | -- |
Source: Public Records
Tax History
| Year | Tax Paid | Tax Assessment Tax Assessment Total Assessment is a certain percentage of the fair market value that is determined by local assessors to be the total taxable value of land and additions on the property. | Land | Improvement |
|---|---|---|---|---|
| 2025 | $6,452 | $318,630 | $97,689 | $227,941 |
| 2024 | $6,452 | $312,245 | $95,773 | $223,472 |
| 2023 | $6,249 | $312,987 | $93,896 | $219,091 |
| 2022 | $6,055 | $299,850 | $92,055 | $214,795 |
| 2021 | $6,051 | $293,834 | $90,250 | $210,584 |
| 2020 | $5,721 | $297,750 | $89,325 | $208,425 |
| 2019 | $5,476 | $291,913 | $87,574 | $204,339 |
| 2018 | $5,360 | $286,190 | $85,857 | $200,333 |
| 2017 | $5,146 | $280,580 | $84,174 | $196,406 |
| 2016 | $4,948 | $275,078 | $82,523 | $192,555 |
| 2015 | $4,869 | $270,947 | $81,284 | $189,663 |
| 2014 | $4,814 | $265,641 | $79,692 | $185,949 |
Source: Public Records
Map
Nearby Homes
- 1144 Dwight Way
- 1142 Dwight Way
- 1118 Dwight Way
- 2324 Browning St
- 1135 Parker St
- 1092 Dwight Way
- 1039 Channing Way
- 2327 10th St Unit 4
- 2231 Byron St
- 2341 9th St
- 2350 Sacramento St
- 2241 Ninth St
- 2717 Mabel St
- 917 Channing Way
- 931 Bancroft Way
- 2751 Wallace St
- 1230 Addison St
- 2411 Sixth St
- 1034 Grayson St
- 1010 Grayson St
- 2427 Browning St
- 2421 Browning St
- 2431 Browning St
- 2417 Browning St
- 2433 Browning St
- 2424 Bonar St
- 2413 Browning St
- 2428 Bonar St
- 2422 Bonar St
- 2430 Bonar St
- 2420 Bonar St
- 2435 Browning St
- 2418 Bonar St
- 2432 Bonar St
- 2409 Browning St
- 2420 Browning St
- 2416 Bonar St
- 2426 Browning St
- 2418 Browning St
- 2437 Browning St
Your Personal Tour Guide
Ask me questions while you tour the home.