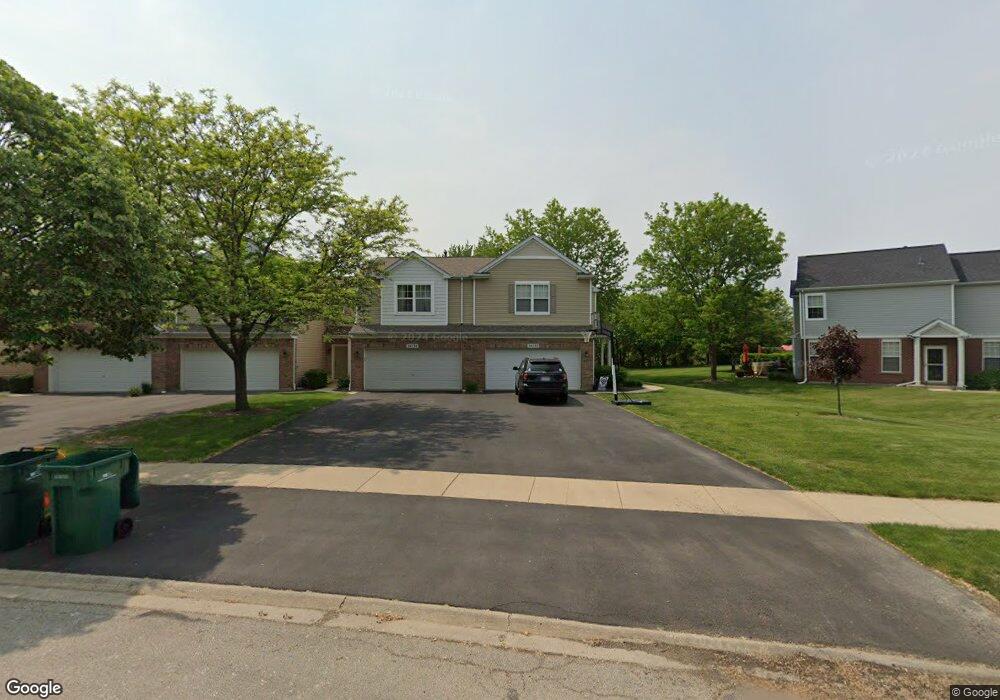
24232 Leski Ln Unit 1 Plainfield, IL 60585
North Plainfield NeighborhoodEstimated Value: $316,659 - $365,000
3
Beds
3
Baths
1,606
Sq Ft
$212/Sq Ft
Est. Value
About This Home
This home is located at 24232 Leski Ln Unit 1, Plainfield, IL 60585 and is currently estimated at $340,665, approximately $212 per square foot. 24232 Leski Ln Unit 1 is a home located in Will County with nearby schools including Freedom Elementary School, Heritage Grove Middle School, and Plainfield North High School.
Ownership History
Date
Name
Owned For
Owner Type
Purchase Details
Closed on
Mar 19, 2008
Sold by
Deutsche Bank National Trust Co
Bought by
Ng Gary
Current Estimated Value
Purchase Details
Closed on
Dec 5, 2007
Sold by
Opal Maureen T and Case 07 Ch 120
Bought by
Deutsche Bank National Trust Co and Argent Mortgage Securities Inc Asset Bac
Purchase Details
Closed on
Jan 1, 2005
Sold by
Centex Homes
Bought by
Opal Maureen T
Home Financials for this Owner
Home Financials are based on the most recent Mortgage that was taken out on this home.
Original Mortgage
$177,463
Interest Rate
8.15%
Mortgage Type
Purchase Money Mortgage
Create a Home Valuation Report for This Property
The Home Valuation Report is an in-depth analysis detailing your home's value as well as a comparison with similar homes in the area
Home Values in the Area
Average Home Value in this Area
Purchase History
| Date | Buyer | Sale Price | Title Company |
|---|---|---|---|
| Ng Gary | $176,000 | Wheatland Title Guaranty | |
| Deutsche Bank National Trust Co | -- | None Available | |
| Opal Maureen T | $197,500 | -- |
Source: Public Records
Mortgage History
| Date | Status | Borrower | Loan Amount |
|---|---|---|---|
| Previous Owner | Opal Maureen T | $177,463 | |
| Closed | Opal Maureen T | $100,000 |
Source: Public Records
Tax History Compared to Growth
Tax History
| Year | Tax Paid | Tax Assessment Tax Assessment Total Assessment is a certain percentage of the fair market value that is determined by local assessors to be the total taxable value of land and additions on the property. | Land | Improvement |
|---|---|---|---|---|
| 2024 | $6,023 | $82,754 | $8,266 | $74,488 |
| 2023 | $6,023 | $73,104 | $7,302 | $65,802 |
| 2022 | $5,305 | $66,201 | $6,906 | $59,295 |
| 2021 | $5,122 | $63,048 | $6,577 | $56,471 |
| 2020 | $5,123 | $62,049 | $6,473 | $55,576 |
| 2019 | $5,053 | $60,301 | $6,291 | $54,010 |
| 2018 | $4,714 | $55,130 | $6,154 | $48,976 |
| 2017 | $4,294 | $49,095 | $5,995 | $43,100 |
| 2016 | $4,310 | $48,038 | $5,866 | $42,172 |
| 2015 | $3,706 | $46,190 | $5,640 | $40,550 |
| 2014 | $3,706 | $39,800 | $5,640 | $34,160 |
| 2013 | $3,706 | $39,800 | $5,640 | $34,160 |
Source: Public Records
Map
Nearby Homes
- 11723 Heritage Meadows Dr
- 24333 Leski Ln
- 12906 S Slate Ln
- 12929 S Platte Trail
- 23236 W Teton Ln
- 24328 Whispering Trails Dr
- 0 W 119th St
- 24181 Pear Tree Cir Unit 171206
- 70AC W 119th St
- 24024 W Champion Dr
- 24115 Pear Tree Cir Unit 170807
- 11640 Century Cir
- 26106 W Sherwood Cir
- 23234 W Allagash Dr
- 11616 Century Cir
- 11920 Winterberry Ln
- 11900 Winterberry Ln
- 24958 Gates Ln Unit 15B
- 2711 Lawlor Ln
- 2668 Lawlor Ln
- 24232 Leski Ln
- 24234 Leski Ln Unit 1
- 24236 Leski Ln Unit 1
- 24230 Leski Ln Unit 1
- 24238 Leski Ln
- 24228 Leski Ln
- 24240 Leski Ln Unit 1
- 24226 Leski Ln Unit 1
- 24242 Leski Ln
- 24242 Leski Ln Unit 1
- 24222 Leski Ln
- 24212 Leski Ln
- 24244 Leski Ln
- 24214 Leski Ln
- 24237 Leski Ln Unit 1
- 24235 Leski Ln
- 24241 Leski Ln Unit 1
- 24216 Leski Ln Unit 1
- 24233 Leski Ln