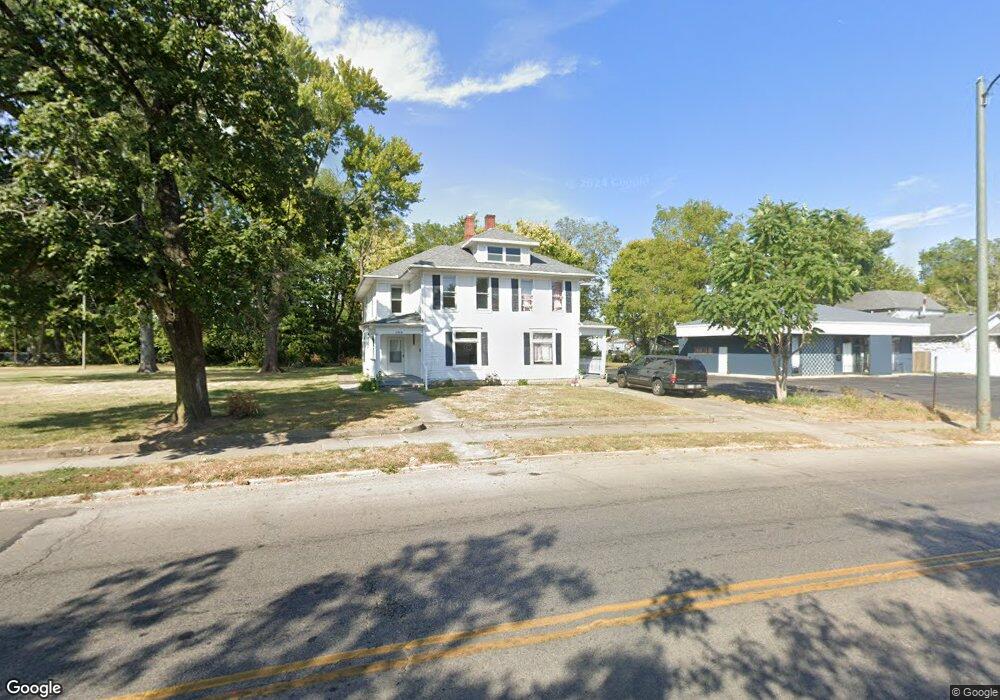
2424 E High St Unit 2426 Springfield, OH 45505
Estimated Value: $154,000 - $178,000
6
Beds
2
Baths
3,456
Sq Ft
$48/Sq Ft
Est. Value
About This Home
This home is located at 2424 E High St Unit 2426, Springfield, OH 45505 and is currently estimated at $165,781, approximately $47 per square foot. 2424 E High St Unit 2426 is a home located in Clark County with nearby schools including Mann Elementary School, Schaefer Middle School, and Springfield High School.
Ownership History
Date
Name
Owned For
Owner Type
Purchase Details
Closed on
Apr 15, 2020
Sold by
Husted Properties Llc
Bought by
Husted Enterprises Llc
Current Estimated Value
Purchase Details
Closed on
Jan 27, 2017
Sold by
Vallejo Robert N and Vallejo Ashley N
Bought by
Husted Properties Llc
Home Financials for this Owner
Home Financials are based on the most recent Mortgage that was taken out on this home.
Original Mortgage
$60,800
Interest Rate
4.16%
Mortgage Type
Future Advance Clause Open End Mortgage
Purchase Details
Closed on
May 21, 2003
Sold by
Vallejo Robert L and Vallejo Maria C
Bought by
Vallejo Robert N
Home Financials for this Owner
Home Financials are based on the most recent Mortgage that was taken out on this home.
Original Mortgage
$93,200
Interest Rate
5.95%
Mortgage Type
Purchase Money Mortgage
Purchase Details
Closed on
Jul 8, 1988
Create a Home Valuation Report for This Property
The Home Valuation Report is an in-depth analysis detailing your home's value as well as a comparison with similar homes in the area
Home Values in the Area
Average Home Value in this Area
Purchase History
| Date | Buyer | Sale Price | Title Company |
|---|---|---|---|
| Husted Enterprises Llc | $44,000 | None Available | |
| Husted Properties Llc | $65,000 | None Available | |
| Vallejo Robert N | $116,500 | -- | |
| -- | $47,800 | -- |
Source: Public Records
Mortgage History
| Date | Status | Borrower | Loan Amount |
|---|---|---|---|
| Previous Owner | Husted Properties Llc | $60,800 | |
| Previous Owner | Vallejo Robert N | $93,200 |
Source: Public Records
Tax History
| Year | Tax Paid | Tax Assessment Tax Assessment Total Assessment is a certain percentage of the fair market value that is determined by local assessors to be the total taxable value of land and additions on the property. | Land | Improvement |
|---|---|---|---|---|
| 2025 | $5,537 | $58,660 | $7,560 | $51,100 |
| 2024 | $11,976 | $45,970 | $6,970 | $39,000 |
| 2023 | $7,699 | $47,660 | $6,970 | $40,690 |
| 2022 | $8,523 | $47,660 | $6,970 | $40,690 |
| 2021 | $2,051 | $37,320 | $5,400 | $31,920 |
| 2020 | $2,055 | $37,320 | $5,400 | $31,920 |
| 2019 | $2,061 | $37,320 | $5,400 | $31,920 |
| 2018 | $2,033 | $35,340 | $6,140 | $29,200 |
| 2017 | $1,975 | $35,340 | $6,136 | $29,204 |
| 2016 | $1,978 | $35,340 | $6,136 | $29,204 |
| 2015 | $2,155 | $37,762 | $6,136 | $31,626 |
| 2014 | $2,146 | $37,762 | $6,136 | $31,626 |
| 2013 | $2,123 | $37,762 | $6,136 | $31,626 |
Source: Public Records
Map
Nearby Homes
- 2424-2426 E High St
- 2425 Kenilworth Ave
- 115 S Burnett Rd
- 129 N Burnett Rd
- 273 S Clairmont Ave
- 2111 Kenilworth Ave
- 360 Buxton Ave
- 250 S Douglas Ave Unit 254
- 2702 Maplewood Ave
- 207 Roseland Ave W
- 374 Raffensperger Ave
- 419 Bellevue Ave
- 515 Bellevue Ave
- 400 S Arlington Ave Unit 402
- 121 Willis Ave
- 1707 Highland Ave
- 1703 Highland Ave
- 2201 Woodside Ave
- 1721 Prospect St
- 1664 Warder St
- 2440 E High St
- 2444 E High St
- 109 Buxton Ave
- 41 Buxton Ave
- 2418 E High St
- 29 Buxton Ave
- 2427 E High St
- 2412 E High St Unit 2414
- 2415 E High St Unit 2417
- 2415 E High St
- 23 Buxton Ave
- 2435 E High St
- 2408 E High St Unit 2410
- 2504 E High St
- 110 Buxton Ave Unit 112
- 40 Buxton Ave
- 24 Buxton Ave
- 2510 E High St
- 228 Raffensperger Ave
- 24 Oakland Ct
Your Personal Tour Guide
Ask me questions while you tour the home.