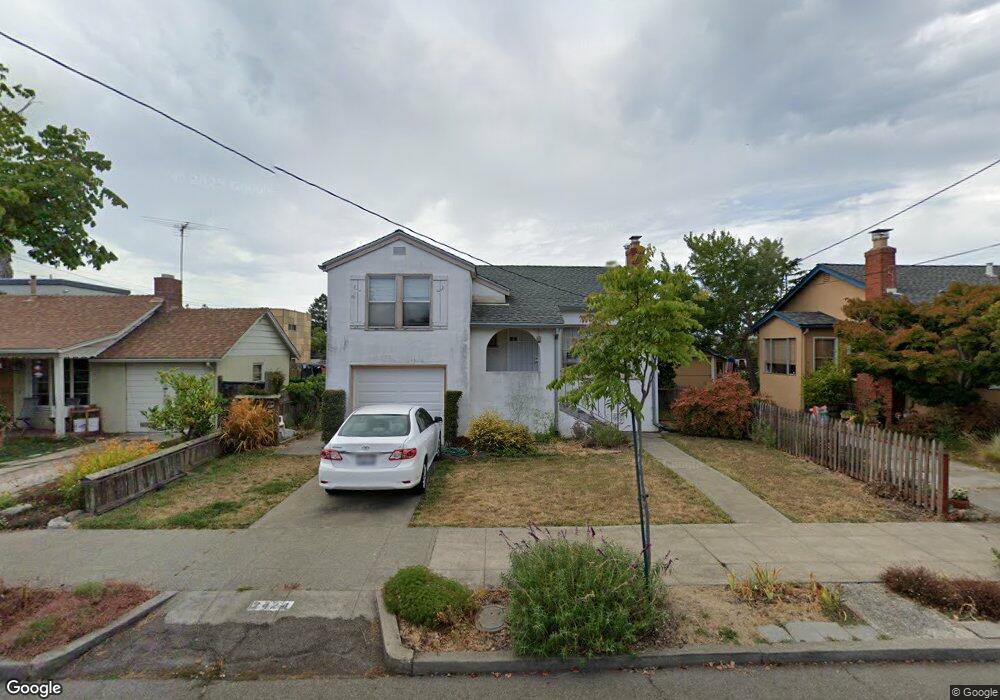
2424 Valley St Berkeley, CA 94702
West Berkeley NeighborhoodEstimated Value: $1,264,769 - $1,347,000
2
Beds
2
Baths
1,400
Sq Ft
$934/Sq Ft
Est. Value
About This Home
This home is located at 2424 Valley St, Berkeley, CA 94702 and is currently estimated at $1,307,442, approximately $933 per square foot. 2424 Valley St is a home located in Alameda County with nearby schools including Oxford Elementary School, Washington Elementary School, and Malcolm X Elementary School.
Ownership History
Date
Name
Owned For
Owner Type
Purchase Details
Closed on
Aug 3, 2000
Sold by
Morita Miyeko and Morita Jane H
Bought by
Buehler Michael G and Abiko Grace H
Current Estimated Value
Home Financials for this Owner
Home Financials are based on the most recent Mortgage that was taken out on this home.
Original Mortgage
$171,500
Outstanding Balance
$62,052
Interest Rate
8.19%
Estimated Equity
$1,245,390
Purchase Details
Closed on
Sep 30, 1993
Sold by
Morita Miyeko
Bought by
Morita Miyeko and Morita Trust
Create a Home Valuation Report for This Property
The Home Valuation Report is an in-depth analysis detailing your home's value as well as a comparison with similar homes in the area
Home Values in the Area
Average Home Value in this Area
Purchase History
| Date | Buyer | Sale Price | Title Company |
|---|---|---|---|
| Buehler Michael G | $383,000 | Placer Title Company | |
| Morita Miyeko | -- | -- |
Source: Public Records
Mortgage History
| Date | Status | Borrower | Loan Amount |
|---|---|---|---|
| Open | Buehler Michael G | $171,500 |
Source: Public Records
Tax History
| Year | Tax Paid | Tax Assessment Tax Assessment Total Assessment is a certain percentage of the fair market value that is determined by local assessors to be the total taxable value of land and additions on the property. | Land | Improvement |
|---|---|---|---|---|
| 2025 | $9,243 | $570,077 | $173,123 | $403,954 |
| 2024 | $9,243 | $558,763 | $169,729 | $396,034 |
| 2023 | $9,045 | $554,671 | $166,401 | $388,270 |
| 2022 | $8,871 | $536,798 | $163,139 | $380,659 |
| 2021 | $8,882 | $526,135 | $159,940 | $373,195 |
| 2020 | $8,386 | $527,670 | $158,301 | $369,369 |
| 2019 | $8,033 | $517,325 | $155,197 | $362,128 |
| 2018 | $7,891 | $507,183 | $152,155 | $355,028 |
| 2017 | $7,599 | $497,240 | $149,172 | $348,068 |
| 2016 | $7,337 | $487,493 | $146,248 | $341,245 |
| 2015 | $7,236 | $480,174 | $144,052 | $336,122 |
| 2014 | $7,179 | $470,771 | $141,231 | $329,540 |
Source: Public Records
Map
Nearby Homes
- 2350 Sacramento St
- 2324 Browning St
- 1144 Dwight Way
- 1142 Dwight Way
- 1524 Blake St
- 1118 Dwight Way
- 1135 Parker St
- 1604 Dwight Way
- 1515 Derby St
- 1612 Parker St
- 2717 Mabel St
- 2231 Byron St
- 1092 Dwight Way
- 1645 Dwight Way
- 1039 Channing Way
- 1634 Blake St
- 2750 Sacramento St
- 1450 Ward St
- 2327 10th St Unit 4
- 2758 Sacramento St
Your Personal Tour Guide
Ask me questions while you tour the home.