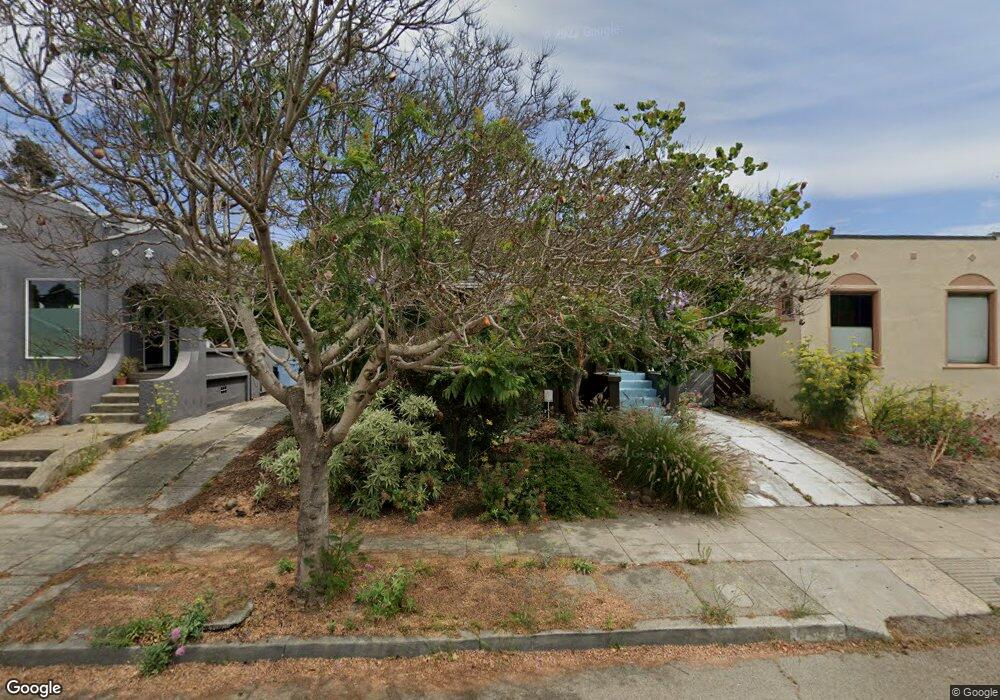
2425 Curtis St Berkeley, CA 94702
West Berkeley NeighborhoodEstimated Value: $1,005,848 - $1,283,000
2
Beds
1
Bath
1,010
Sq Ft
$1,106/Sq Ft
Est. Value
About This Home
This home is located at 2425 Curtis St, Berkeley, CA 94702 and is currently estimated at $1,117,462, approximately $1,106 per square foot. 2425 Curtis St is a home located in Alameda County with nearby schools including Rosa Parks Elementary School, Ruth Acty Elementary, and Berkeley Arts Magnet at Whittier School.
Ownership History
Date
Name
Owned For
Owner Type
Purchase Details
Closed on
Jun 20, 2014
Sold by
Humphrey Nancy
Bought by
Humphrey Nancy and The Nancy Humphrey Living Trus
Current Estimated Value
Purchase Details
Closed on
Dec 1, 1998
Sold by
Pinion Ethel
Bought by
Humphrey Nancy
Home Financials for this Owner
Home Financials are based on the most recent Mortgage that was taken out on this home.
Original Mortgage
$174,800
Interest Rate
6.69%
Create a Home Valuation Report for This Property
The Home Valuation Report is an in-depth analysis detailing your home's value as well as a comparison with similar homes in the area
Home Values in the Area
Average Home Value in this Area
Purchase History
| Date | Buyer | Sale Price | Title Company |
|---|---|---|---|
| Humphrey Nancy | -- | None Available | |
| Humphrey Nancy | $222,000 | Old Republic Title Company |
Source: Public Records
Mortgage History
| Date | Status | Borrower | Loan Amount |
|---|---|---|---|
| Previous Owner | Humphrey Nancy | $174,800 | |
| Closed | Humphrey Nancy | $25,000 |
Source: Public Records
Tax History
| Year | Tax Paid | Tax Assessment Tax Assessment Total Assessment is a certain percentage of the fair market value that is determined by local assessors to be the total taxable value of land and additions on the property. | Land | Improvement |
|---|---|---|---|---|
| 2025 | $6,346 | $341,011 | $104,403 | $243,608 |
| 2024 | $6,346 | $334,188 | $102,356 | $238,832 |
| 2023 | $6,200 | $334,500 | $100,350 | $234,150 |
| 2022 | $6,063 | $320,941 | $98,382 | $229,559 |
| 2021 | $6,057 | $314,513 | $96,454 | $225,059 |
| 2020 | $5,681 | $318,216 | $95,465 | $222,751 |
| 2019 | $5,398 | $311,978 | $93,593 | $218,385 |
| 2018 | $5,292 | $305,861 | $91,758 | $214,103 |
| 2017 | $5,080 | $299,865 | $89,959 | $209,906 |
| 2016 | $4,873 | $293,987 | $88,196 | $205,791 |
| 2015 | $4,801 | $289,571 | $86,871 | $202,700 |
| 2014 | $4,751 | $283,900 | $85,170 | $198,730 |
Source: Public Records
Map
Nearby Homes
- 1142 Dwight Way
- 1118 Dwight Way
- 2324 Browning St
- 1092 Dwight Way
- 1039 Channing Way
- 2327 10th St Unit 4
- 2231 Byron St
- 2241 Ninth St
- 2144 Curtis St
- 931 Bancroft Way
- 2747 San Pablo Ave Unit 507
- 2751 Wallace St
- 1034 Grayson St
- 2238 7th St
- 1010 Grayson St
- 2220 7th St
- 1050 Allston Way
- 1515 Derby St
- 1450 Ward St
- 2750 Sacramento St
- 2421 Curtis St
- 2429 Curtis St
- 2419 Curtis St
- 2433 Curtis St
- 2435 Curtis St
- 2417 Curtis St
- 2426 Browning St
- 2428 Browning St
- 2420 Browning St
- 2434 Browning St
- 2418 Browning St
- 2439 Curtis St
- 2415 Curtis St
- 2436 Browning St
- 2416 Browning St
- 2428 Curtis St
- 2424 Curtis St
- 2430 Curtis St
- 2432 Curtis St
- 2420 Curtis St
Your Personal Tour Guide
Ask me questions while you tour the home.