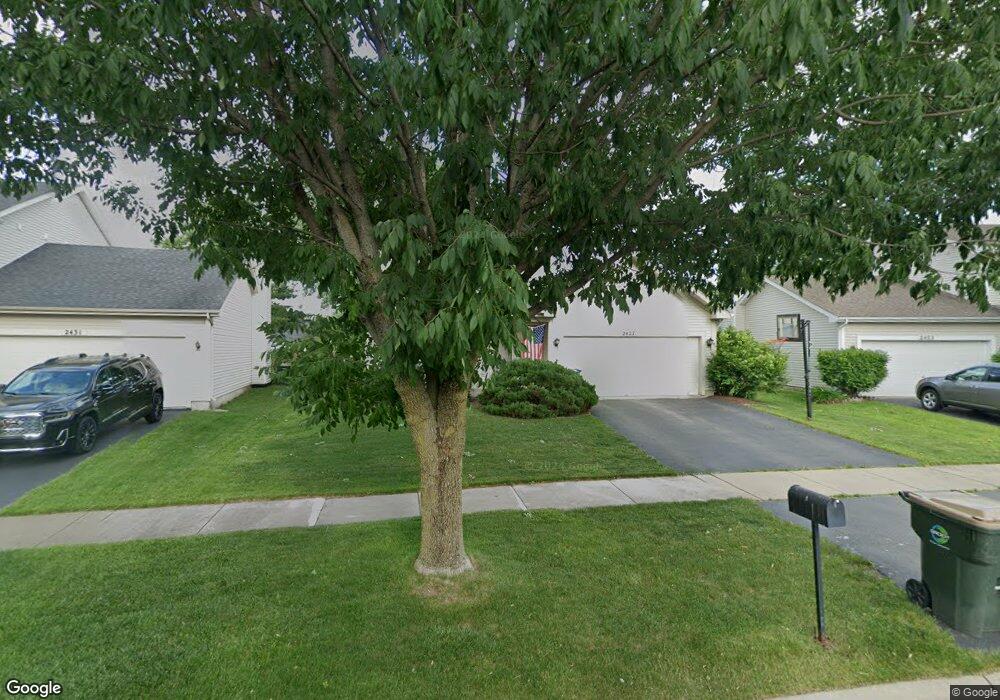
2427 Warm Springs Ln Naperville, IL 60564
Wood Lake NeighborhoodEstimated Value: $355,000 - $494,000
3
Beds
2
Baths
1,432
Sq Ft
$299/Sq Ft
Est. Value
About This Home
This home is located at 2427 Warm Springs Ln, Naperville, IL 60564 and is currently estimated at $427,465, approximately $298 per square foot. 2427 Warm Springs Ln is a home located in Will County with nearby schools including Welch Elementary School, Ellsworth Elementary School, and Scullen Middle School.
Ownership History
Date
Name
Owned For
Owner Type
Purchase Details
Closed on
Sep 23, 2013
Sold by
Harkness Shaun and Harkness Karen M
Bought by
Harkness Shaun and Harkness Karen M
Current Estimated Value
Purchase Details
Closed on
Jan 10, 2008
Sold by
Harkness Shaun and Harkness Karen M
Bought by
Harkness Shaun and Harkness Karen M
Purchase Details
Closed on
Apr 24, 2007
Sold by
Oconnor Daniel J and Oconnor Carrie M
Bought by
Harkness Shaun and Moore Karen M
Home Financials for this Owner
Home Financials are based on the most recent Mortgage that was taken out on this home.
Original Mortgage
$254,600
Outstanding Balance
$154,361
Interest Rate
6.2%
Mortgage Type
Purchase Money Mortgage
Estimated Equity
$273,104
Purchase Details
Closed on
Jun 5, 1997
Sold by
Woodlake Ltd Partnership
Bought by
Oconnor Daniel J and Oconnor Carrie M
Home Financials for this Owner
Home Financials are based on the most recent Mortgage that was taken out on this home.
Original Mortgage
$141,100
Interest Rate
8%
Create a Home Valuation Report for This Property
The Home Valuation Report is an in-depth analysis detailing your home's value as well as a comparison with similar homes in the area
Home Values in the Area
Average Home Value in this Area
Purchase History
| Date | Buyer | Sale Price | Title Company |
|---|---|---|---|
| Harkness Shaun | -- | None Available | |
| Harkness Shaun | -- | None Available | |
| Harkness Shaun | $262,500 | Attorneys Title Guaranty Fun | |
| Oconnor Daniel J | $149,000 | -- |
Source: Public Records
Mortgage History
| Date | Status | Borrower | Loan Amount |
|---|---|---|---|
| Open | Harkness Shaun | $254,600 | |
| Previous Owner | Oconnor Daniel J | $141,100 |
Source: Public Records
Tax History Compared to Growth
Tax History
| Year | Tax Paid | Tax Assessment Tax Assessment Total Assessment is a certain percentage of the fair market value that is determined by local assessors to be the total taxable value of land and additions on the property. | Land | Improvement |
|---|---|---|---|---|
| 2024 | $7,381 | $120,692 | $34,632 | $86,060 |
| 2023 | $7,381 | $106,619 | $30,594 | $76,025 |
| 2022 | $7,017 | $102,854 | $28,940 | $73,914 |
| 2021 | $6,698 | $97,956 | $27,562 | $70,394 |
| 2020 | $6,568 | $96,404 | $27,125 | $69,279 |
| 2019 | $6,450 | $93,688 | $26,361 | $67,327 |
| 2018 | $5,895 | $84,699 | $25,782 | $58,917 |
| 2017 | $5,800 | $82,512 | $25,116 | $57,396 |
| 2016 | $5,784 | $80,735 | $24,575 | $56,160 |
| 2015 | $5,807 | $77,630 | $23,630 | $54,000 |
| 2014 | $5,807 | $76,593 | $23,630 | $52,963 |
| 2013 | $5,807 | $76,593 | $23,630 | $52,963 |
Source: Public Records
Map
Nearby Homes
- 2736 Bluewater Cir
- 2543 Dewes Ln
- 2207 Sisters Ave
- 2866 Stonewater Dr Unit 102
- 2611 Cedar Glade Dr Unit 204
- 2511 Sheehan Dr Unit 203
- 2636 Salix Cir
- 2949 Brossman St
- 28W555 Leverenz Rd
- 2220 Waterleaf Ct Unit 204
- 2227 Waterleaf Ct Unit 203
- 3311 Fairmont Ave
- 3349 Rosecroft Ln Unit 2
- 1329 Neskola Ct
- 2301 Mecan Dr
- 1305 Morningstar Ct Unit 1A
- 3003 Kingbird Ct Unit IV
- 1321 Galena Ct
- 3408 Parliament Ln Unit 1
- 2741 Gateshead Dr
- 2423 Warm Springs Ln Unit 2
- 2431 Warm Springs Ln
- 2824 Bluewater Cir
- 2820 Bluewater Cir
- 2435 Warm Springs Ln
- 2419 Warm Springs Ln Unit 2
- 2816 Bluewater Cir
- 2828 Bluewater Cir
- 2812 Bluewater Cir Unit 2
- 2428 Warm Springs Ln
- 2832 Bluewater Cir
- 2439 Warm Springs Ln
- 2420 Warm Springs Ln
- 2415 Warm Springs Ln
- 2808 Bluewater Cir
- 2416 Warm Springs Ln Unit 2
- 2443 Warm Springs Ln Unit 2
- 2411 Warm Springs Ln
- 2804 Bluewater Cir Unit 2
- 2440 Warm Springs Ln