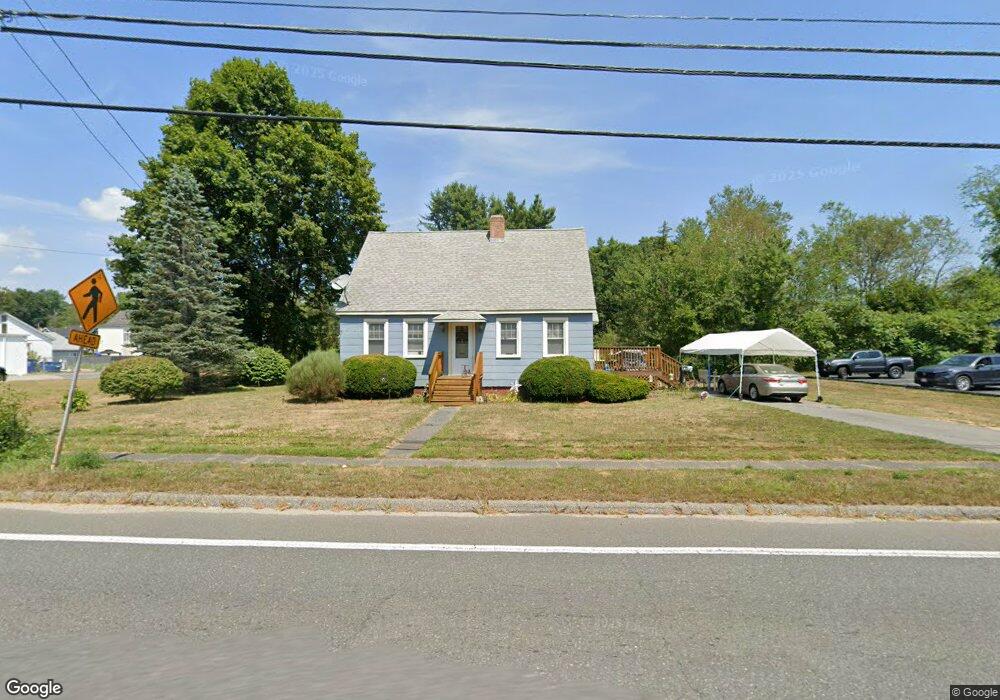
243 E Main St Orange, MA 01364
Estimated Value: $220,000 - $288,000
2
Beds
1
Bath
1,287
Sq Ft
$207/Sq Ft
Est. Value
About This Home
This home is located at 243 E Main St, Orange, MA 01364 and is currently estimated at $266,699, approximately $207 per square foot. 243 E Main St is a home located in Franklin County with nearby schools including Fisher Hill and Ralph C Mahar Regional School.
Ownership History
Date
Name
Owned For
Owner Type
Purchase Details
Closed on
Sep 2, 2010
Sold by
Sabine Julia E and Krouse Charles M
Bought by
Richardson Diane L
Current Estimated Value
Home Financials for this Owner
Home Financials are based on the most recent Mortgage that was taken out on this home.
Original Mortgage
$71,200
Outstanding Balance
$46,539
Interest Rate
4.55%
Mortgage Type
Purchase Money Mortgage
Estimated Equity
$220,160
Purchase Details
Closed on
Nov 6, 2009
Sold by
Partenheimer Julia E
Bought by
Sabine Julia E and Krouse Charles M
Purchase Details
Closed on
Jan 20, 1989
Sold by
Bartlett Norman E
Bought by
Ledgard John P
Home Financials for this Owner
Home Financials are based on the most recent Mortgage that was taken out on this home.
Original Mortgage
$140,000
Interest Rate
10.38%
Mortgage Type
Purchase Money Mortgage
Create a Home Valuation Report for This Property
The Home Valuation Report is an in-depth analysis detailing your home's value as well as a comparison with similar homes in the area
Home Values in the Area
Average Home Value in this Area
Purchase History
| Date | Buyer | Sale Price | Title Company |
|---|---|---|---|
| Richardson Diane L | $75,000 | -- | |
| Sabine Julia E | -- | -- | |
| Ledgard John P | $110,000 | -- |
Source: Public Records
Mortgage History
| Date | Status | Borrower | Loan Amount |
|---|---|---|---|
| Open | Richardson Diane L | $71,200 | |
| Previous Owner | Ledgard John P | $15,000 | |
| Previous Owner | Ledgard John P | $10,000 | |
| Previous Owner | Ledgard John P | $140,000 | |
| Previous Owner | Ledgard John P | $10,000 |
Source: Public Records
Tax History
| Year | Tax Paid | Tax Assessment Tax Assessment Total Assessment is a certain percentage of the fair market value that is determined by local assessors to be the total taxable value of land and additions on the property. | Land | Improvement |
|---|---|---|---|---|
| 2025 | $38 | $232,200 | $28,700 | $203,500 |
| 2024 | $3,136 | $179,800 | $28,700 | $151,100 |
| 2023 | $2,543 | $141,600 | $25,800 | $115,800 |
| 2022 | $2,619 | $137,000 | $25,800 | $111,200 |
| 2021 | $2,687 | $134,000 | $44,700 | $89,300 |
| 2020 | $5,027 | $129,100 | $40,800 | $88,300 |
| 2019 | $2,534 | $112,500 | $35,300 | $77,200 |
| 2018 | $2,396 | $109,200 | $32,900 | $76,300 |
| 2017 | $2,318 | $109,200 | $32,900 | $76,300 |
| 2016 | $2,144 | $98,800 | $29,400 | $69,400 |
| 2015 | $2,085 | $100,400 | $31,400 | $69,000 |
| 2014 | $2,002 | $101,400 | $31,400 | $70,000 |
Source: Public Records
Map
Nearby Homes
- 253 E Main St
- 232 E Main St
- 217 E Main St
- 15 Jones St
- 224 E Main St
- 252-258 E Main St
- 252 E Main St
- 62 Battle St
- 218 E Main St
- 26 Whitney St
- 66 Battle St Unit 1
- 66 Battle St Unit B
- 270 E Main St
- 212 E Main St
- 30 Whitney St
- 208 E Main St
- 208 E Main St Unit 2
- 208 E Main St Unit 1
- 201 E Main St
- 11 Whitney St
Your Personal Tour Guide
Ask me questions while you tour the home.