Estimated Value: $524,160 - $683,000
7
Beds
2
Baths
2,676
Sq Ft
$215/Sq Ft
Est. Value
About This Home
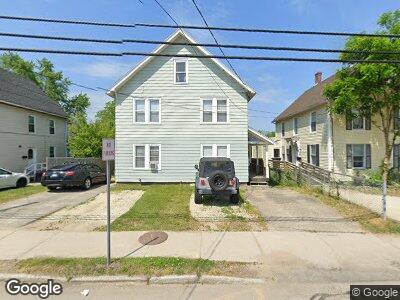
This home is located at 243 Locust St, Dover, NH 03820 and is currently estimated at $574,540, approximately $214 per square foot. 243 Locust St is a home located in Strafford County with nearby schools including Woodman Park School, Dover Middle School, and Dover Senior High School.
Ownership History
Date
Name
Owned For
Owner Type
Purchase Details
Closed on
Aug 26, 2014
Sold by
Dion Jeremy P
Bought by
Dion Jeremy P and Dion Aimee L
Current Estimated Value
Home Financials for this Owner
Home Financials are based on the most recent Mortgage that was taken out on this home.
Original Mortgage
$170,000
Interest Rate
4.14%
Mortgage Type
Purchase Money Mortgage
Purchase Details
Closed on
Jul 31, 2006
Sold by
Bc4 Surf 2004
Bought by
Dion Jeremy P
Home Financials for this Owner
Home Financials are based on the most recent Mortgage that was taken out on this home.
Original Mortgage
$151,525
Interest Rate
8%
Mortgage Type
Adjustable Rate Mortgage/ARM
Purchase Details
Closed on
Jul 5, 2006
Sold by
Jp Morgan Chase Bk Na
Bought by
Jp Morgan Chase Bk Na
Home Financials for this Owner
Home Financials are based on the most recent Mortgage that was taken out on this home.
Original Mortgage
$151,525
Interest Rate
8%
Mortgage Type
Adjustable Rate Mortgage/ARM
Create a Home Valuation Report for This Property
The Home Valuation Report is an in-depth analysis detailing your home's value as well as a comparison with similar homes in the area
Home Values in the Area
Average Home Value in this Area
Purchase History
| Date | Buyer | Sale Price | Title Company |
|---|---|---|---|
| Dion Jeremy P | -- | -- | |
| Dion Jeremy P | $159,500 | -- | |
| Dion Jeremy P | $159,500 | -- | |
| Jp Morgan Chase Bk Na | $216,900 | -- |
Source: Public Records
Mortgage History
| Date | Status | Borrower | Loan Amount |
|---|---|---|---|
| Open | Dion Aimee | $70,000 | |
| Open | Dion Jeremy P | $142,000 | |
| Closed | Dion Jeremy P | $170,000 | |
| Previous Owner | Jp Morgan Chase Bk Na | $50,000 | |
| Previous Owner | Dion Jeremy P | $151,525 |
Source: Public Records
Tax History Compared to Growth
Tax History
| Year | Tax Paid | Tax Assessment Tax Assessment Total Assessment is a certain percentage of the fair market value that is determined by local assessors to be the total taxable value of land and additions on the property. | Land | Improvement |
|---|---|---|---|---|
| 2024 | $9,412 | $518,000 | $164,200 | $353,800 |
| 2023 | $7,890 | $421,900 | $140,800 | $281,100 |
| 2022 | $7,396 | $372,800 | $132,900 | $239,900 |
| 2021 | $7,556 | $348,200 | $132,900 | $215,300 |
| 2020 | $7,964 | $320,500 | $121,200 | $199,300 |
| 2019 | $7,678 | $304,800 | $109,500 | $195,300 |
| 2018 | $7,147 | $286,800 | $97,800 | $189,000 |
| 2017 | $6,444 | $249,100 | $74,300 | $174,800 |
| 2016 | $5,413 | $205,900 | $66,100 | $139,800 |
| 2015 | $5,067 | $190,400 | $61,900 | $128,500 |
| 2014 | $4,952 | $190,400 | $61,900 | $128,500 |
| 2011 | $5,140 | $204,600 | $80,500 | $124,100 |
Source: Public Records
Map
Nearby Homes
- 31 Lenox Dr Unit B
- 35 Lenox Dr Unit B
- 30 Lenox Dr Unit D
- 37 Lenox Dr Unit B
- 29 Lenox Dr Unit B
- 32 Lenox Dr Unit D
- 2 Hamilton St
- 57 Rutland St
- Lot 3 Emerson Ridge Unit 3
- 181 Central Ave
- 84 Court St
- 11 Locke St
- 21 Little Bay Dr
- 33 Little Bay Dr
- 35 Mill St
- 93 Henry Law Ave Unit 21
- 20-22 Kirkland St
- 9 Hartswood Rd
- 11-2 Porch Light Dr Unit 2
- 204 Silver St