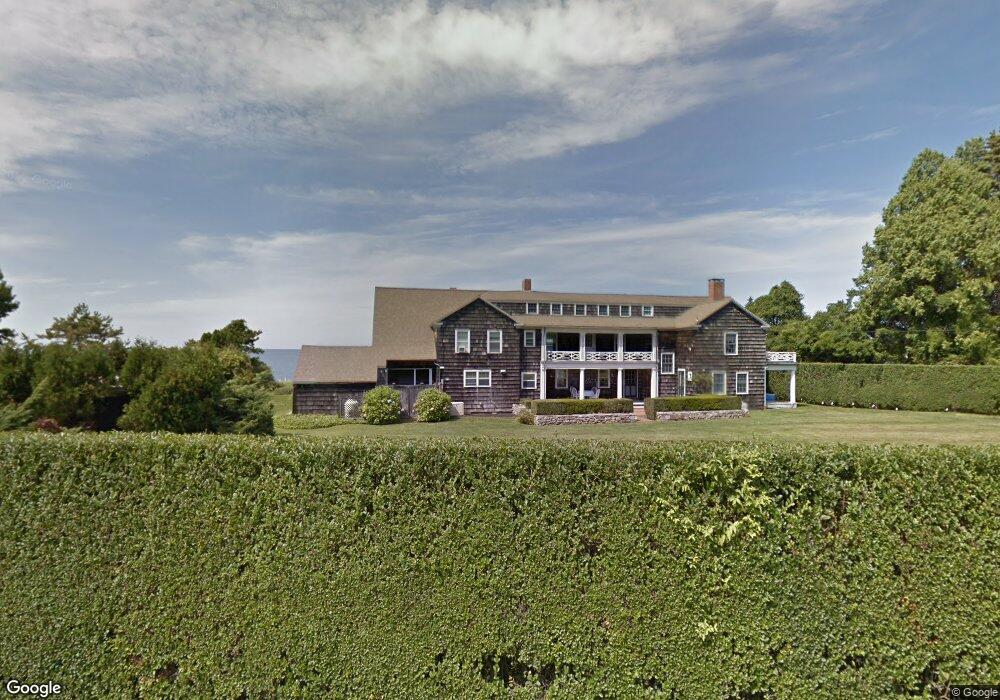
243 Old Black Point Rd Niantic, CT 06357
Estimated Value: $4,770,000 - $6,353,698
8
Beds
12
Baths
9,814
Sq Ft
$569/Sq Ft
Est. Value
About This Home
This home is located at 243 Old Black Point Rd, Niantic, CT 06357 and is currently estimated at $5,583,175, approximately $568 per square foot. 243 Old Black Point Rd is a home located in New London County with nearby schools including East Lyme Middle School, East Lyme High School, and The Light House Voc-Ed Center.
Ownership History
Date
Name
Owned For
Owner Type
Purchase Details
Closed on
Jan 25, 2016
Sold by
Alastair-Hunt John and Hunt Pauline B
Bought by
Hunt J Alastair and Hunt Pauline B
Current Estimated Value
Purchase Details
Closed on
Jan 12, 2007
Sold by
Eddy Terry
Bought by
Hunt Alastair John and Hunt Pauline B
Home Financials for this Owner
Home Financials are based on the most recent Mortgage that was taken out on this home.
Original Mortgage
$3,000,000
Interest Rate
6.12%
Purchase Details
Closed on
Jul 30, 1999
Sold by
Est Rogers Washburn P and Rogers Nicholas L
Bought by
Eddy James H and Eddy Terry J
Create a Home Valuation Report for This Property
The Home Valuation Report is an in-depth analysis detailing your home's value as well as a comparison with similar homes in the area
Home Values in the Area
Average Home Value in this Area
Purchase History
| Date | Buyer | Sale Price | Title Company |
|---|---|---|---|
| Hunt J Alastair | -- | -- | |
| Hunt Alastair John | $4,000,000 | -- | |
| Eddy James H | $1,500,000 | -- | |
| Hunt J Alastair J | -- | -- | |
| Hunt Alastair John | $4,000,000 | -- | |
| Eddy James H | $1,500,000 | -- |
Source: Public Records
Mortgage History
| Date | Status | Borrower | Loan Amount |
|---|---|---|---|
| Previous Owner | Eddy James H | $3,000,000 | |
| Previous Owner | Eddy James H | $1,500,000 |
Source: Public Records
Tax History Compared to Growth
Tax History
| Year | Tax Paid | Tax Assessment Tax Assessment Total Assessment is a certain percentage of the fair market value that is determined by local assessors to be the total taxable value of land and additions on the property. | Land | Improvement |
|---|---|---|---|---|
| 2025 | $85,763 | $3,061,870 | $1,270,640 | $1,791,230 |
| 2024 | $80,680 | $3,061,870 | $1,270,640 | $1,791,230 |
| 2023 | $76,179 | $3,061,870 | $1,270,640 | $1,791,230 |
| 2022 | $72,995 | $3,061,870 | $1,270,640 | $1,791,230 |
| 2021 | $59,242 | $2,077,950 | $1,270,640 | $807,310 |
| 2020 | $42,172 | $1,487,010 | $1,270,640 | $216,370 |
| 2019 | $48,295 | $1,713,180 | $1,270,640 | $442,540 |
| 2018 | $46,855 | $1,713,180 | $1,270,640 | $442,540 |
| 2017 | $44,817 | $1,713,180 | $1,270,640 | $442,540 |
| 2016 | $50,212 | $1,979,950 | $1,466,150 | $513,800 |
| 2015 | $48,925 | $1,979,950 | $1,466,150 | $513,800 |
| 2014 | $47,578 | $1,979,950 | $1,466,150 | $513,800 |
Source: Public Records
Map
Nearby Homes
- 11 Sunset Ave
- 35 Bellaire Rd
- 4 Nehantic Dr
- 19 E Shore Dr
- 15 Griswold Rd
- 245 Giants Neck Rd
- 94 Old Black Point Rd
- 7 Old Black Point Rd
- 22 Shore Rd
- 150 Black Point Rd
- 146 Black Point Rd
- 76 S Edgewood Rd
- 127 Black Point Rd Unit 11
- 99 Spring Glen Rd
- 20 Spinnaker Dr
- 3 Sunnieside Dr
- 68-70 Black Point Rd
- 49 Ridgewood Rd
- 78 Corey Ln Unit 9
- 9 Columbus Ave
- 239 Old Black Point Rd
- 249 Old Black Point Rd
- 250 Old Black Point Rd
- 246 Old Black Point Rd
- 235 Old Black Point Rd
- 251 Old Black Point Rd
- 5 Francis Ln
- 4 Hemingway Rd
- 11 Great Wight Way
- 2 Francis Ln
- 257 Old Black Point Rd
- 231 Old Black Point Rd
- 10 Great Wight Way
- 258 Old Black Point Rd
- 6 Hemingway Rd
- 14 Great Wight Way
- 12 Great Wight Way
- 9 Francis Ln
- 260 Old Black Point Rd
- 232 Old Black Point Rd