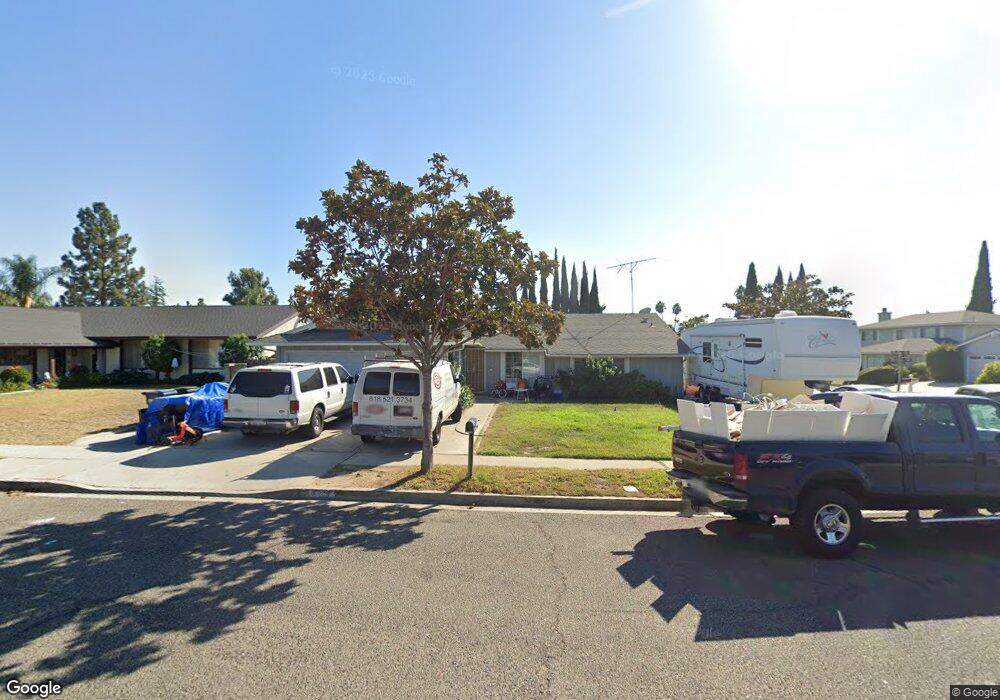
2430 E Phyllis St Simi Valley, CA 93065
Central Simi Valley NeighborhoodEstimated Value: $759,000 - $846,000
4
Beds
2
Baths
1,729
Sq Ft
$468/Sq Ft
Est. Value
About This Home
This home is located at 2430 E Phyllis St, Simi Valley, CA 93065 and is currently estimated at $809,379, approximately $468 per square foot. 2430 E Phyllis St is a home located in Ventura County with nearby schools including Park View Elementary School, Hillside Middle School, and Royal High School.
Ownership History
Date
Name
Owned For
Owner Type
Purchase Details
Closed on
Feb 11, 2021
Sold by
Knowles Phillip Thomas
Bought by
Barger Anne Marie
Current Estimated Value
Home Financials for this Owner
Home Financials are based on the most recent Mortgage that was taken out on this home.
Original Mortgage
$504,000
Outstanding Balance
$450,773
Interest Rate
2.7%
Mortgage Type
New Conventional
Estimated Equity
$358,606
Purchase Details
Closed on
Dec 26, 2008
Sold by
2430 Phyllis Llc
Bought by
Knowles Philip Thomas
Purchase Details
Closed on
Mar 6, 2008
Sold by
Knowles Philip T
Bought by
2430 Phyllis Llc
Purchase Details
Closed on
Aug 22, 2007
Sold by
Knowles Julie Ann
Bought by
Knowles Philip T
Home Financials for this Owner
Home Financials are based on the most recent Mortgage that was taken out on this home.
Original Mortgage
$329,000
Interest Rate
6.87%
Mortgage Type
Purchase Money Mortgage
Purchase Details
Closed on
Aug 7, 2007
Sold by
Southall Patrick A and Southall Betrina Moore
Bought by
Knowles Philip T
Home Financials for this Owner
Home Financials are based on the most recent Mortgage that was taken out on this home.
Original Mortgage
$329,000
Interest Rate
6.87%
Mortgage Type
Purchase Money Mortgage
Purchase Details
Closed on
Nov 7, 2002
Sold by
Garner John Hardy and Garner Deborah Kaye
Bought by
Southall Patrick A and Moore Southall Betrina
Home Financials for this Owner
Home Financials are based on the most recent Mortgage that was taken out on this home.
Original Mortgage
$277,600
Interest Rate
6.28%
Purchase Details
Closed on
Jan 11, 2000
Sold by
May Joseph F and May Elizabeth A
Bought by
Garner John Hardy and Garner Deborah Kaye
Home Financials for this Owner
Home Financials are based on the most recent Mortgage that was taken out on this home.
Original Mortgage
$184,000
Interest Rate
8%
Purchase Details
Closed on
May 2, 1997
Sold by
May Joseph F and May Elizabeth Ann
Bought by
May Joseph F and May Elizabeth Ann
Home Financials for this Owner
Home Financials are based on the most recent Mortgage that was taken out on this home.
Original Mortgage
$152,000
Interest Rate
8.14%
Purchase Details
Closed on
May 17, 1996
Sold by
Wiltz Joycelyn L
Bought by
May Joseph F and May Elizabeth Ann
Home Financials for this Owner
Home Financials are based on the most recent Mortgage that was taken out on this home.
Original Mortgage
$148,000
Interest Rate
9.12%
Create a Home Valuation Report for This Property
The Home Valuation Report is an in-depth analysis detailing your home's value as well as a comparison with similar homes in the area
Home Values in the Area
Average Home Value in this Area
Purchase History
| Date | Buyer | Sale Price | Title Company |
|---|---|---|---|
| Barger Anne Marie | $560,000 | Stewart Title Of Ca Inc | |
| Knowles Philip Thomas | $330,000 | Old Republic Title | |
| 2430 Phyllis Llc | -- | None Available | |
| Knowles Philip T | -- | Chicago Title Company | |
| Knowles Philip T | $470,000 | Chicago Title Company | |
| Southall Patrick A | $347,000 | Fidelity National Title Co | |
| Garner John Hardy | $230,000 | Old Republic Title Company | |
| May Joseph F | $90,500 | -- | |
| May Joseph F | $185,000 | Old Republic Title Company |
Source: Public Records
Mortgage History
| Date | Status | Borrower | Loan Amount |
|---|---|---|---|
| Open | Barger Anne Marie | $504,000 | |
| Previous Owner | Knowles Philip T | $329,000 | |
| Previous Owner | Southall Patrick A | $277,600 | |
| Previous Owner | Garner John Hardy | $184,000 | |
| Previous Owner | May Joseph F | $152,000 | |
| Previous Owner | May Joseph F | $148,000 | |
| Closed | May Joseph F | $18,500 | |
| Closed | May Joseph F | $28,500 | |
| Closed | Garner John Hardy | $46,000 |
Source: Public Records
Tax History
| Year | Tax Paid | Tax Assessment Tax Assessment Total Assessment is a certain percentage of the fair market value that is determined by local assessors to be the total taxable value of land and additions on the property. | Land | Improvement |
|---|---|---|---|---|
| 2025 | $8,892 | $750,124 | $487,636 | $262,488 |
| 2024 | $8,892 | $735,416 | $478,074 | $257,342 |
| 2023 | $8,365 | $720,997 | $468,700 | $252,297 |
| 2022 | $8,356 | $706,860 | $459,510 | $247,350 |
| 2021 | $4,980 | $392,585 | $255,183 | $137,402 |
| 2020 | $4,873 | $388,561 | $252,567 | $135,994 |
| 2019 | $4,652 | $380,943 | $247,615 | $133,328 |
| 2018 | $4,610 | $373,474 | $242,760 | $130,714 |
| 2017 | $4,505 | $366,151 | $238,000 | $128,151 |
| 2016 | $4,303 | $358,973 | $233,334 | $125,639 |
| 2015 | $4,210 | $353,582 | $229,830 | $123,752 |
| 2014 | $4,148 | $346,658 | $225,329 | $121,329 |
Source: Public Records
Map
Nearby Homes
- 2516 E Phyllis St
- 2718 Licia Place
- 2752 Wanda Ave
- 2325 Wisteria St
- 2781 N Woodrow Ave
- 2357 Lawnview Ct
- 2183 E Chesterton St
- 2385 N Justin Ave
- 2671 Coral Gum Ln
- 2235 Clover St
- 2756 N Dalenhurst Place
- 2832 Thicket Place
- 3067 Harrison Ln
- 3010 Tallahassee Ln
- 3049 Tallahassee Ln
- 2189 Latham St
- 2146 N Brower St
- 2497 Orangewood Place
- 2239 McDonald St
- 2405 Lee St
- 2442 E Phyllis St
- 2548 N Phyllis St
- 2454 E Phyllis St
- 2551 N Phyllis St
- 2534 N Phyllis St
- 2443 Marie St
- 2565 N Phyllis St
- 2433 E Phyllis St
- 2543 N Phyllis St
- 2445 E Phyllis St
- 2411 E Phyllis St
- 2593 N Phyllis St
- 2467 E Phyllis St
- 2535 N Phyllis St
- 2466 E Phyllis St
- 2455 Marie St
- 2520 N Phyllis St
- 2431 Marie St
- 2560 Loretta Cir
- 2552 Loretta Cir
Your Personal Tour Guide
Ask me questions while you tour the home.