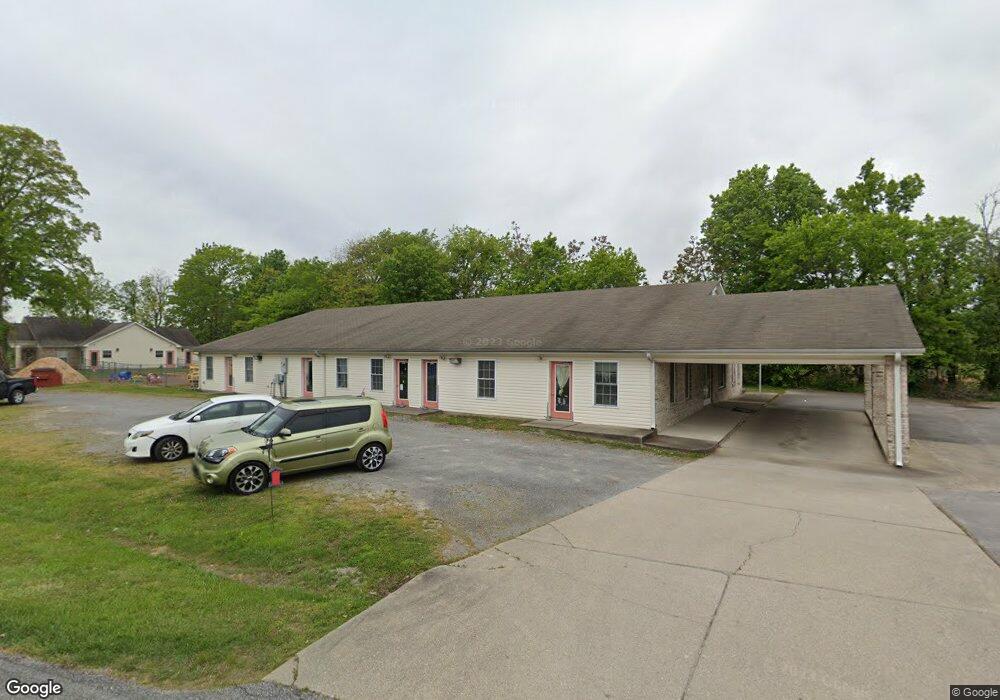
2430 Red Boiling Springs Rd Lafayette, TN 37083
Estimated Value: $241,782
--
Bed
5
Baths
2,144
Sq Ft
$113/Sq Ft
Est. Value
About This Home
This home is located at 2430 Red Boiling Springs Rd, Lafayette, TN 37083 and is currently estimated at $241,782, approximately $112 per square foot. 2430 Red Boiling Springs Rd is a home located in Macon County with nearby schools including Macon Christian Academy.
Ownership History
Date
Name
Owned For
Owner Type
Purchase Details
Closed on
Nov 27, 2023
Sold by
Ritchie Stacie
Bought by
Because Of Billy
Current Estimated Value
Home Financials for this Owner
Home Financials are based on the most recent Mortgage that was taken out on this home.
Original Mortgage
$193,500
Outstanding Balance
$190,367
Interest Rate
7.63%
Mortgage Type
New Conventional
Estimated Equity
$51,415
Purchase Details
Closed on
Jul 22, 2022
Sold by
Stacie Ritchie
Bought by
Royal Jonathon and Royal Stephanie
Purchase Details
Closed on
Jun 24, 2005
Bought by
Ritchie Stacey
Purchase Details
Closed on
Aug 17, 1943
Bought by
Segraves Marshall
Create a Home Valuation Report for This Property
The Home Valuation Report is an in-depth analysis detailing your home's value as well as a comparison with similar homes in the area
Home Values in the Area
Average Home Value in this Area
Purchase History
| Date | Buyer | Sale Price | Title Company |
|---|---|---|---|
| Because Of Billy | $215,000 | Benchmark Title | |
| Royal Jonathon | $275,000 | Andrew A Stanford Attorney At | |
| Ritchie Stacey | $29,000 | -- | |
| Segraves Marshall | -- | -- |
Source: Public Records
Mortgage History
| Date | Status | Borrower | Loan Amount |
|---|---|---|---|
| Open | Because Of Billy | $193,500 |
Source: Public Records
Tax History Compared to Growth
Tax History
| Year | Tax Paid | Tax Assessment Tax Assessment Total Assessment is a certain percentage of the fair market value that is determined by local assessors to be the total taxable value of land and additions on the property. | Land | Improvement |
|---|---|---|---|---|
| 2024 | $2,147 | $114,240 | $16,000 | $98,240 |
| 2023 | $2,147 | $114,240 | $0 | $0 |
| 2022 | $6,595 | $209,360 | $4,040 | $205,320 |
| 2021 | $6,491 | $209,360 | $4,040 | $205,320 |
| 2020 | $6,491 | $209,360 | $4,040 | $205,320 |
| 2019 | $6,491 | $209,360 | $4,040 | $205,320 |
| 2018 | $6,000 | $209,360 | $4,040 | $205,320 |
| 2017 | $6,217 | $190,120 | $8,680 | $181,440 |
| 2016 | $5,989 | $190,120 | $8,680 | $181,440 |
| 2015 | $5,989 | $190,120 | $8,680 | $181,440 |
| 2014 | $5,989 | $190,112 | $0 | $0 |
Source: Public Records
Map
Nearby Homes
- 2464 Red Boiling Springs Rd
- 0 Union Camp Rd Unit RTC3001729
- 0 Union Camp Rd Unit 238991
- 0 Union Camp Rd Unit RTC2981013
- 51 Mary's Ln
- 73 Mary's Ln
- 375 Autumn Ridge Ln
- 1036 Union Camp Rd
- 445 Marys Ln
- 1263 Union Camp Rd
- 21 Highway 52 E
- 22 Highway 52 E
- 1 Highway 52 E
- 3326 Highway 52 E
- 0 Days Rd
- 903 Days Rd
- 139 Forkum Ln
- 519 Swanee St
- 515 Greenwood Dr
- 608 Days Rd
- 60 Seagraves Rd
- 60 Segraves Rd
- 53 Seagraves Rd
- 2486 Red Boiling Springs Rd
- 203 Union Camp Rd
- 118 Union Camp Rd
- 227 Union Camp Rd
- 39 Addison Hollow Rd
- 1 Union Camp Rd
- 6 Union Camp Rd
- 0 Union Camp Rd
- 0 Union Camp Rd Unit RTC2796369
- 0 Union Camp Rd Unit RTC1781403
- 0 Union Camp Rd Unit RTC1222729
- 0 Union Camp Rd Unit RTC2762933
- 0 Union Camp Rd Unit RTC2697583
- 0 Union Camp Rd Unit RTC2643342
- 0 Union Camp Rd Unit RTC1476863
- 0 Union Camp Rd Unit RTC2637740
- 0 Union Camp Rd Unit RTC2622849