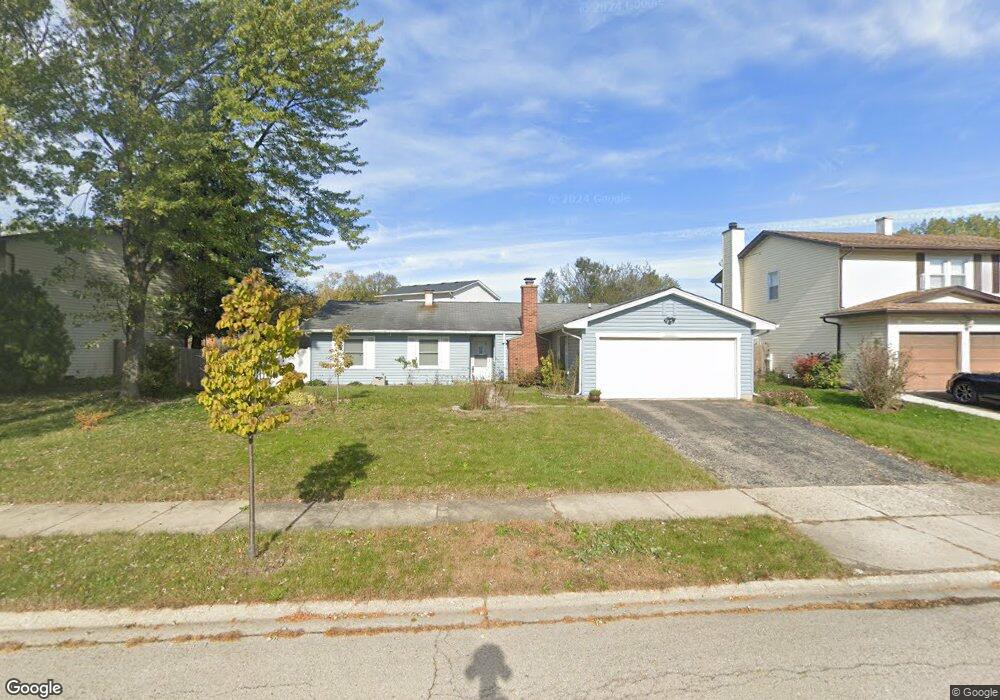
2432 S Crescent Ln Aurora, IL 60504
South East Village NeighborhoodEstimated Value: $334,000 - $380,000
3
Beds
2
Baths
1,470
Sq Ft
$242/Sq Ft
Est. Value
About This Home
This home is located at 2432 S Crescent Ln, Aurora, IL 60504 and is currently estimated at $356,241, approximately $242 per square foot. 2432 S Crescent Ln is a home located in DuPage County with nearby schools including Georgetown Elementary School, Fischer Middle School, and Waubonsie Valley High School.
Ownership History
Date
Name
Owned For
Owner Type
Purchase Details
Closed on
Dec 4, 2009
Sold by
Hebreard Daniel P and Hebreard Donna C
Bought by
Roussos Betty
Current Estimated Value
Purchase Details
Closed on
Oct 30, 2002
Sold by
Obrien Joanne
Bought by
Hebreard Daniel P and Fredericks Donna C
Home Financials for this Owner
Home Financials are based on the most recent Mortgage that was taken out on this home.
Original Mortgage
$157,700
Interest Rate
6.08%
Purchase Details
Closed on
Jul 27, 2000
Sold by
Markham Michael A and Markham Jan A
Bought by
Obrien Joanne
Home Financials for this Owner
Home Financials are based on the most recent Mortgage that was taken out on this home.
Original Mortgage
$148,750
Interest Rate
8.24%
Mortgage Type
FHA
Create a Home Valuation Report for This Property
The Home Valuation Report is an in-depth analysis detailing your home's value as well as a comparison with similar homes in the area
Home Values in the Area
Average Home Value in this Area
Purchase History
| Date | Buyer | Sale Price | Title Company |
|---|---|---|---|
| Roussos Betty | $194,500 | Prairie Title Inc | |
| Hebreard Daniel P | $166,000 | Law Title | |
| Obrien Joanne | $150,000 | Law Title Pick Up |
Source: Public Records
Mortgage History
| Date | Status | Borrower | Loan Amount |
|---|---|---|---|
| Previous Owner | Hebreard Daniel P | $157,700 | |
| Previous Owner | Obrien Joanne | $148,750 |
Source: Public Records
Tax History Compared to Growth
Tax History
| Year | Tax Paid | Tax Assessment Tax Assessment Total Assessment is a certain percentage of the fair market value that is determined by local assessors to be the total taxable value of land and additions on the property. | Land | Improvement |
|---|---|---|---|---|
| 2024 | -- | $98,091 | $30,549 | $67,542 |
| 2023 | $5,251 | $88,140 | $27,450 | $60,690 |
| 2022 | $6,257 | $80,610 | $24,910 | $55,700 |
| 2021 | $6,085 | $77,730 | $24,020 | $53,710 |
| 2020 | $6,159 | $77,730 | $24,020 | $53,710 |
| 2019 | $5,934 | $73,930 | $22,850 | $51,080 |
| 2018 | $4,890 | $61,360 | $18,810 | $42,550 |
| 2017 | $4,800 | $59,280 | $18,170 | $41,110 |
| 2016 | $4,705 | $56,890 | $17,440 | $39,450 |
| 2015 | $4,645 | $54,020 | $16,560 | $37,460 |
| 2014 | $4,887 | $55,050 | $16,760 | $38,290 |
| 2013 | $4,839 | $55,440 | $16,880 | $38,560 |
Source: Public Records
Map
Nearby Homes
- 2476 Village Ct Unit 2
- 2297 Lakeside Dr Unit 10
- 2632 Emma Cir
- 1629 Silver Springs Ct
- 1335 Lawrence Ct
- 2489 Rosehall Ln
- 2509 Rosehall Ln
- 2730 Dorothy Dr Unit 1
- 1465 Bridgeport Ln Unit 19D
- 2860 Bridgeport Ln Unit 19D
- 2723 Rosehall Ln
- 2484 Warwick Ct
- 1875 Keating Dr
- 1871 Keating Dr
- 1855 Keating Dr
- 2538 Needham Ct
- 1966 Congrove Dr
- 3144 Johnsbury Ln
- 1722 Baler Ave
- 1728 Baler Ave
- 2442 S Crescent Ln
- 2422 S Crescent Ln
- 2421 N Crescent Ln
- 2411 N Crescent Ln
- 2433 S Crescent Ln
- 2425 S Crescent Ln Unit 3
- 2443 S Crescent Ln
- 2401 N Crescent Ln
- 2402 S Crescent Ln
- 2423 S Crescent Ln
- 2450 N Crescent Ln
- 2430 N Crescent Ln
- 2440 N Crescent Ln
- 2420 N Crescent Ln
- 2450 N Cres Ln
- 2415 S Crescent Ln
- 2453 S Crescent Ln
- 2410 N Crescent Ln
- 2413 S Crescent Ln
- 2391 N Crescent Ln