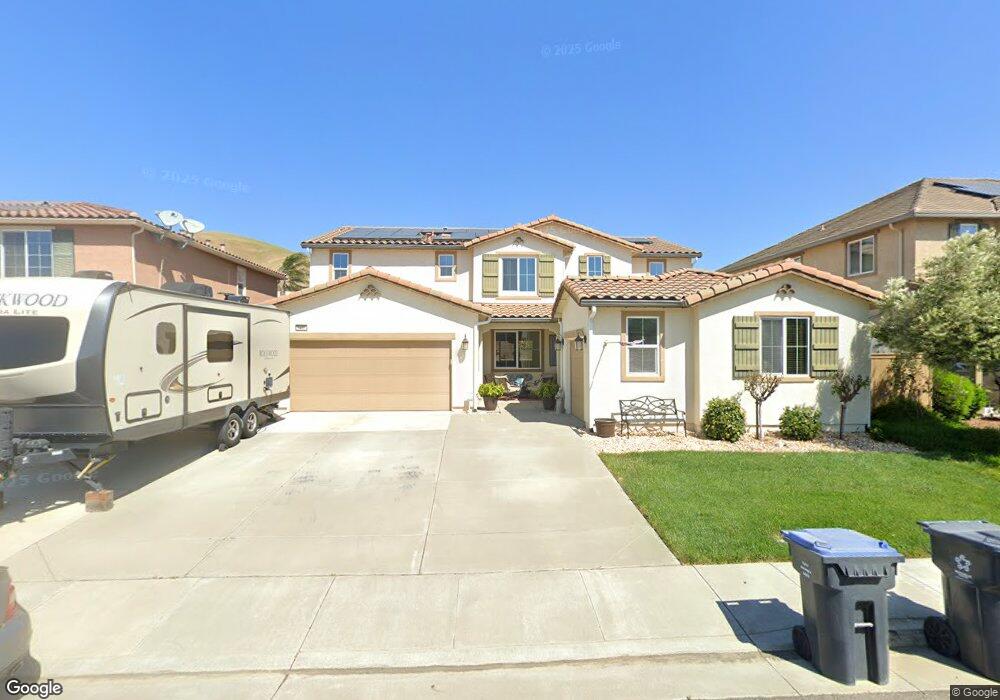
2432 Sanders Ln Fairfield, CA 94533
Estimated Value: $845,424 - $920,000
5
Beds
4
Baths
3,393
Sq Ft
$261/Sq Ft
Est. Value
About This Home
This home is located at 2432 Sanders Ln, Fairfield, CA 94533 and is currently estimated at $885,856, approximately $261 per square foot. 2432 Sanders Ln is a home with nearby schools including Center Elementary School, Golden West Middle School, and Vanden High School.
Ownership History
Date
Name
Owned For
Owner Type
Purchase Details
Closed on
Sep 10, 2021
Sold by
Pockrandt Randall K and Blotzer Pockrandt Joelten
Bought by
Pockrandt Randall K and Blotzer Pockrandt Joelten
Current Estimated Value
Purchase Details
Closed on
Nov 11, 2020
Sold by
Pockrandt Randall K and Blotzer Pockrandt Jolleen
Bought by
Pockrandt Randall K and Blotzer Pockrandt Joellen
Home Financials for this Owner
Home Financials are based on the most recent Mortgage that was taken out on this home.
Original Mortgage
$374,000
Outstanding Balance
$332,807
Interest Rate
2.8%
Mortgage Type
New Conventional
Estimated Equity
$553,049
Purchase Details
Closed on
Oct 27, 2014
Sold by
Richmond American Homes Of Maryland Inc
Bought by
Pockrandt Randall K and Blotzer Joellen S
Home Financials for this Owner
Home Financials are based on the most recent Mortgage that was taken out on this home.
Original Mortgage
$417,000
Interest Rate
4.2%
Mortgage Type
New Conventional
Create a Home Valuation Report for This Property
The Home Valuation Report is an in-depth analysis detailing your home's value as well as a comparison with similar homes in the area
Home Values in the Area
Average Home Value in this Area
Purchase History
| Date | Buyer | Sale Price | Title Company |
|---|---|---|---|
| Pockrandt Randall K | -- | None Available | |
| Pockrandt Randall K | -- | Chicago Title Company | |
| Pockrandt Randall K | $560,000 | First American Title Company |
Source: Public Records
Mortgage History
| Date | Status | Borrower | Loan Amount |
|---|---|---|---|
| Open | Pockrandt Randall K | $374,000 | |
| Closed | Pockrandt Randall K | $417,000 |
Source: Public Records
Tax History Compared to Growth
Tax History
| Year | Tax Paid | Tax Assessment Tax Assessment Total Assessment is a certain percentage of the fair market value that is determined by local assessors to be the total taxable value of land and additions on the property. | Land | Improvement |
|---|---|---|---|---|
| 2025 | $9,663 | $673,025 | $90,132 | $582,893 |
| 2024 | $9,663 | $659,829 | $88,365 | $571,464 |
| 2023 | $9,533 | $646,892 | $86,633 | $560,259 |
| 2022 | $9,158 | $634,209 | $84,936 | $549,273 |
| 2021 | $9,025 | $621,774 | $83,271 | $538,503 |
| 2020 | $8,905 | $615,400 | $82,418 | $532,982 |
| 2019 | $8,743 | $603,334 | $80,802 | $522,532 |
| 2018 | $8,624 | $591,505 | $79,218 | $512,287 |
| 2017 | $8,376 | $579,908 | $77,665 | $502,243 |
| 2016 | $8,268 | $568,539 | $76,143 | $492,396 |
| 2015 | $8,140 | $560,000 | $75,000 | $485,000 |
| 2014 | $3,511 | $135,613 | $135,613 | $0 |
Source: Public Records
Map
Nearby Homes
- 2433 Sanders Ln
- 2437 Sanders Ln
- 5277 Shumway Place
- 5291 Finkas Ln
- 5299 Elmquest Ct
- 5378 Discovery Way
- 2326 Ray Venning Ct
- 5206 Conley Ln
- 2472 Shorey Way
- 5360 Discovery Way
- 5348 Discovery Way
- 5348 Gramercy Cir
- 2746 Gracie Place
- 5311 Gramercy Cir
- 2715 Blakely Ln
- 2541 Rowe Dr
- 5041 N Parr Ln
- 2438 Sheldon Dr
- 5041 Ellis Godfrey Dr
- 6012 Big Sky Dr
- 2436 Sanders Ln
- 2424 Sanders Ln
- 2440 Sanders Ln
- 2429 Sanders Ln
- 2425 Hancock Dr
- 2433 Hancock Dr
- 2441 Sanders Ln
- 2420 Sanders Ln
- 2425 Sanders Ln
- 2421 Hancock Dr
- 2437 Hancock Dr
- 2421 Sanders Ln
- 2417 Hancock Dr
- 2445 Sanders Ln
- 2416 Sanders Ln
- 2441 Hancock Dr
- 2460 Chuck Hammond Dr
- 2445 Hagemann Way
- 2456 Chuck Hammond Dr
- 2464 Chuck Hammond Dr