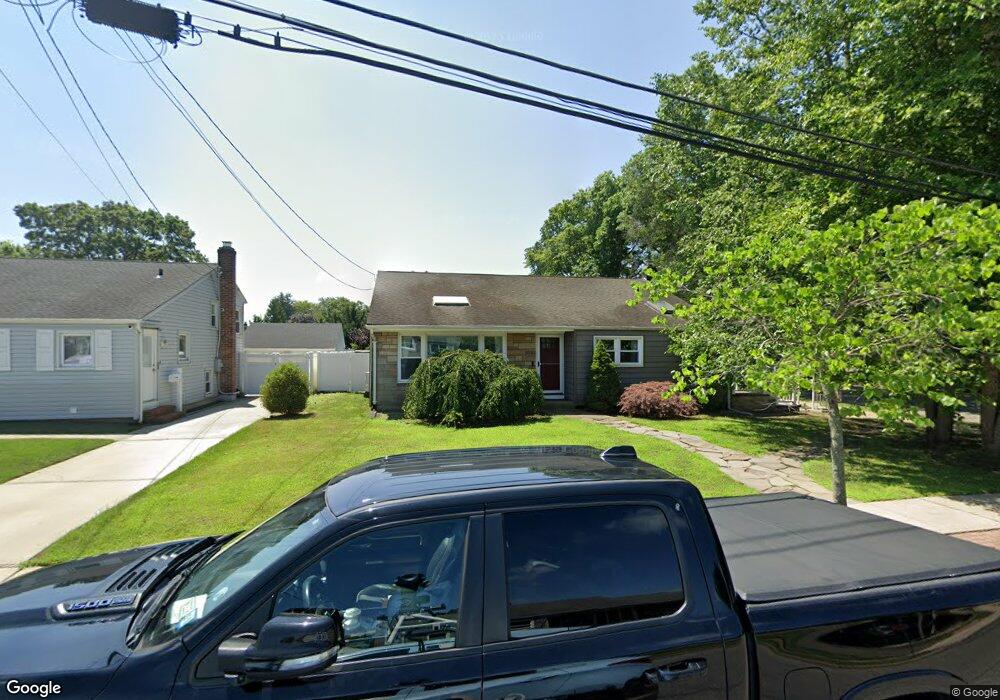
2432 Swenson Place Bellmore, NY 11710
Estimated Value: $746,000 - $801,411
3
Beds
2
Baths
1,657
Sq Ft
$467/Sq Ft
Est. Value
About This Home
This home is located at 2432 Swenson Place, Bellmore, NY 11710 and is currently estimated at $773,706, approximately $466 per square foot. 2432 Swenson Place is a home located in Nassau County with nearby schools including Winthrop Avenue School, Shore Road School, and Grand Avenue Middle School.
Ownership History
Date
Name
Owned For
Owner Type
Purchase Details
Closed on
Apr 19, 2021
Sold by
Miller Sean and Miller Diane
Bought by
Podolski John P and Horn Joann Marie
Current Estimated Value
Home Financials for this Owner
Home Financials are based on the most recent Mortgage that was taken out on this home.
Original Mortgage
$428,750
Outstanding Balance
$387,728
Interest Rate
3.1%
Mortgage Type
New Conventional
Estimated Equity
$385,979
Purchase Details
Closed on
Aug 29, 2014
Sold by
Caffrey Carolee
Bought by
Miller Diane and Miller Sean
Purchase Details
Closed on
Jul 11, 2014
Sold by
Peterson Charles C and Caffrey Carolee
Bought by
Caffrey Carolee
Purchase Details
Closed on
Jul 1, 2008
Sold by
Davis Josephine
Bought by
Peterson Charles
Purchase Details
Closed on
Sep 18, 2007
Sold by
Davis Josephine
Purchase Details
Closed on
Oct 11, 1996
Create a Home Valuation Report for This Property
The Home Valuation Report is an in-depth analysis detailing your home's value as well as a comparison with similar homes in the area
Home Values in the Area
Average Home Value in this Area
Purchase History
| Date | Buyer | Sale Price | Title Company |
|---|---|---|---|
| Podolski John P | $612,500 | First American Title | |
| Miller Diane | $415,000 | Abstracts Incorporated | |
| Caffrey Carolee | -- | -- | |
| Peterson Charles | $395,000 | -- | |
| -- | -- | -- | |
| -- | -- | -- |
Source: Public Records
Mortgage History
| Date | Status | Borrower | Loan Amount |
|---|---|---|---|
| Open | Podolski John P | $428,750 |
Source: Public Records
Tax History Compared to Growth
Tax History
| Year | Tax Paid | Tax Assessment Tax Assessment Total Assessment is a certain percentage of the fair market value that is determined by local assessors to be the total taxable value of land and additions on the property. | Land | Improvement |
|---|---|---|---|---|
| 2025 | $13,485 | $493 | $212 | $281 |
| 2024 | $3,046 | $466 | $192 | $274 |
| 2023 | $12,615 | $515 | $212 | $303 |
| 2022 | $12,615 | $515 | $212 | $303 |
| 2021 | $19,444 | $493 | $203 | $290 |
| 2020 | $13,361 | $679 | $568 | $111 |
| 2019 | $3,453 | $727 | $497 | $230 |
| 2018 | $9,066 | $889 | $0 | $0 |
| 2017 | $9,655 | $889 | $608 | $281 |
| 2016 | $13,548 | $889 | $608 | $281 |
| 2015 | $3,552 | $871 | $608 | $263 |
| 2014 | $3,552 | $871 | $608 | $263 |
| 2013 | $3,335 | $871 | $608 | $263 |
Source: Public Records
Map
Nearby Homes
- 205 Howell St
- 204 Howell St
- 2434 Martin Ave
- 105 Howell St
- 123 Mitchell St
- 2355 Mitchell Place
- 10 Airway Dr
- 5 Oak Brook Ln
- 201 Argyle Place
- 118 Linden St
- 208 Camp Ave
- 70 Nancy Blvd
- 1804 Leona Ct
- 1776 Roberta Ln
- 13 Metropolitan Ave
- 2468 Lincoln Blvd
- 15 Jefferson Ave
- 2522 Lincoln Blvd
- 2693 Martin Ave
- 2325 Centre Ave
- 2438 Swenson Place
- 2081 Skipper Ct
- 2444 Swenson Place
- 2070 Skipper Ct
- 2076 Skipper Ct
- 2427 Swenson Place
- 2089 Skipper Ct
- 2439 Swenson Place
- 2456 Swenson Place
- 2082 Newbridge Rd
- 2415 Swenson Place
- 2445 Swenson Place
- 2422 Swenson Place
- 2111 Skipper Ct
- 2086 Skipper Ct
- 2088 Newbridge Rd
- 2420 Swenson Place
- 2106 Newbridge Rd
- 2109 Skipper Ct
- 2092 Skipper Ct