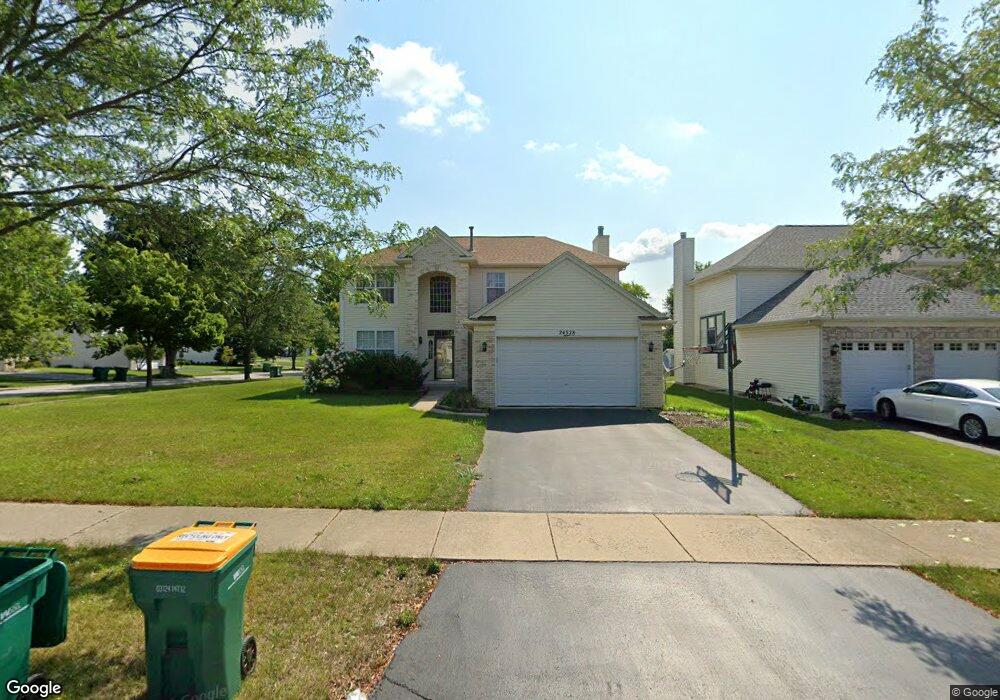
24328 Apple Tree Ln Plainfield, IL 60585
North Plainfield NeighborhoodEstimated Value: $421,069 - $498,000
Studio
1
Bath
2,314
Sq Ft
$204/Sq Ft
Est. Value
About This Home
This home is located at 24328 Apple Tree Ln, Plainfield, IL 60585 and is currently estimated at $471,267, approximately $203 per square foot. 24328 Apple Tree Ln is a home located in Will County with nearby schools including Eagle Pointe Elementary School, Heritage Grove Middle School, and Plainfield North High School.
Ownership History
Date
Name
Owned For
Owner Type
Purchase Details
Closed on
Jan 13, 2019
Sold by
Simhadri Ravi V and Simhadri Rupa V
Bought by
Simhadri Ravi V and Simhadri Rupa V
Current Estimated Value
Purchase Details
Closed on
Sep 5, 2009
Sold by
Simhadri Ravi and Simhadri Rupa
Bought by
Simhadri Ravi and Simhadri Rupa
Home Financials for this Owner
Home Financials are based on the most recent Mortgage that was taken out on this home.
Original Mortgage
$120,000
Interest Rate
5.07%
Mortgage Type
New Conventional
Purchase Details
Closed on
Jan 1, 2004
Sold by
Pasquinelli Inc
Bought by
Simhadri Ravi V and Tanukula Rupa
Home Financials for this Owner
Home Financials are based on the most recent Mortgage that was taken out on this home.
Original Mortgage
$207,776
Interest Rate
5%
Mortgage Type
Purchase Money Mortgage
Create a Home Valuation Report for This Property
The Home Valuation Report is an in-depth analysis detailing your home's value as well as a comparison with similar homes in the area
Home Values in the Area
Average Home Value in this Area
Purchase History
| Date | Buyer | Sale Price | Title Company |
|---|---|---|---|
| Simhadri Ravi V | -- | Attorney | |
| Simhadri Ravi | -- | Citywide Title Corporation | |
| Simhadri Ravi V | $260,000 | Chicago Title Insurance Co |
Source: Public Records
Mortgage History
| Date | Status | Borrower | Loan Amount |
|---|---|---|---|
| Closed | Simhadri Ravi | $120,000 | |
| Previous Owner | Simhadri Ravi V | $207,776 | |
| Closed | Simhadri Ravi V | $25,972 |
Source: Public Records
Tax History
| Year | Tax Paid | Tax Assessment Tax Assessment Total Assessment is a certain percentage of the fair market value that is determined by local assessors to be the total taxable value of land and additions on the property. | Land | Improvement |
|---|---|---|---|---|
| 2024 | $8,955 | $131,052 | $32,376 | $98,676 |
| 2023 | $8,955 | $115,771 | $28,601 | $87,170 |
| 2022 | $7,757 | $102,792 | $27,055 | $75,737 |
| 2021 | $7,466 | $97,897 | $25,767 | $72,130 |
| 2020 | $7,459 | $96,346 | $25,359 | $70,987 |
| 2019 | $7,344 | $93,630 | $24,644 | $68,986 |
| 2018 | $7,381 | $92,318 | $22,825 | $69,493 |
| 2017 | $7,341 | $89,935 | $22,236 | $67,699 |
| 2016 | $7,356 | $87,999 | $21,757 | $66,242 |
| 2015 | $7,311 | $84,614 | $20,920 | $63,694 |
| 2014 | $7,311 | $84,521 | $20,920 | $63,601 |
| 2013 | $7,311 | $84,521 | $20,920 | $63,601 |
Source: Public Records
Map
Nearby Homes
- 12740 S Nicholas Dr
- 24336 Apple Tree Ln
- 24339 Apple Tree Ln
- 24329 Leski Ln Unit 1
- 24190 Pear Tree Cir Unit 171308
- 11823 Wolf Creek Ln
- 24029 Pear Tree Cir
- 12361 S Meridian Ln
- 0 W 119th St
- 12455 S Compass Ave
- 11920 Winterberry Ln
- 12460 S Compass Ave
- 24604 W Cardinal Point
- 12542 Larkspur Ln
- 12445 S 248th St
- 24944 Franklin Ln Unit 131
- 24050 W Champion Dr
- 11640 Century Cir
- 12312 Blue Iris Ln
- 11616 Century Cir
- 24324 Apple Tree Ln
- 24327 Whispering Trails Dr
- 24336 Whispering Trails Dr
- 24318 Apple Tree Ln
- 24321 Whispering Trails Dr
- 24310 Apple Tree Ln
- 24327 Apple Tree Ln
- 24325 Apple Tree Ln
- 24320 Whispering Trails Dr
- 12738 S Nicholas Dr
- 12762 S Nicholas Dr
- 12839 S Nicholas Dr
- 12835 S Nicholas Dr
- 12833 S Nicholas Dr
- 12742 S Nicholas Dr
- 12746 S Nicholas Dr
- 24308 Apple Tree Ln
- 24315 Whispering Trails Dr
- 24329 Apple Tree Ln
- 24323 Apple Tree Ln
Your Personal Tour Guide
Ask me questions while you tour the home.