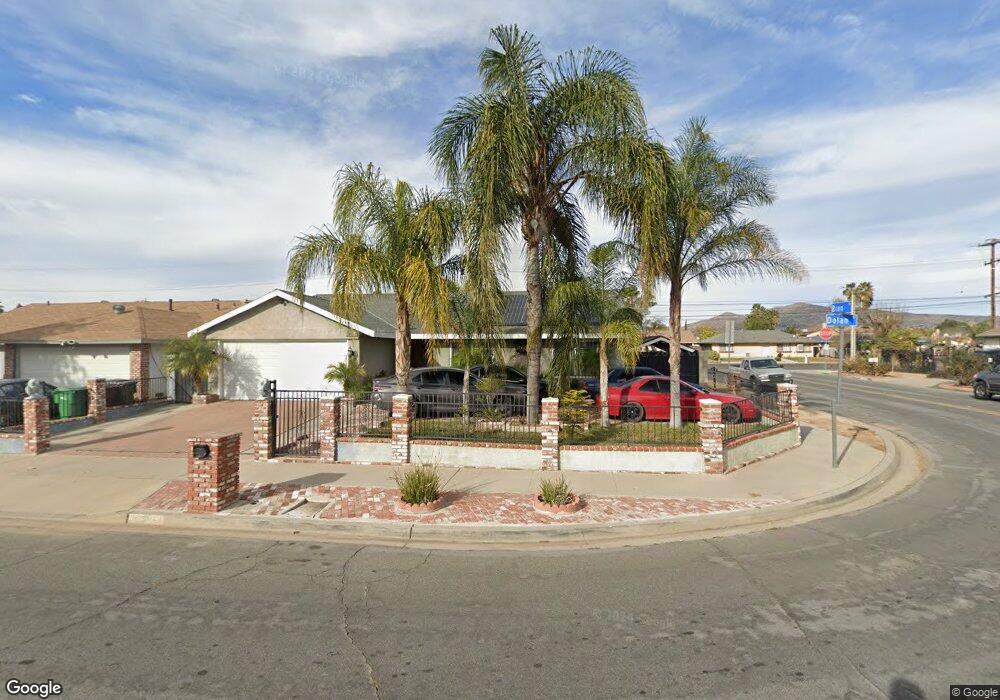
24338 Dolan Dr Moreno Valley, CA 92553
Ramona NeighborhoodEstimated Value: $484,321 - $537,000
4
Beds
2
Baths
1,342
Sq Ft
$382/Sq Ft
Est. Value
About This Home
This home is located at 24338 Dolan Dr, Moreno Valley, CA 92553 and is currently estimated at $512,580, approximately $381 per square foot. 24338 Dolan Dr is a home located in Riverside County with nearby schools including Ramona Elementary School, Sunnymead Middle School, and Moreno Valley High School.
Ownership History
Date
Name
Owned For
Owner Type
Purchase Details
Closed on
Feb 5, 2025
Sold by
Paz Marco A and Paz Irma Elena
Bought by
Paz Family Trust and Paz
Current Estimated Value
Purchase Details
Closed on
Jan 21, 2018
Sold by
Paz Marco A
Bought by
Paz Marco A and Paz Irma Elena
Purchase Details
Closed on
May 16, 2003
Sold by
Depaz Irma Elena Aldana
Bought by
Paz Marco A
Home Financials for this Owner
Home Financials are based on the most recent Mortgage that was taken out on this home.
Original Mortgage
$120,000
Interest Rate
5.22%
Mortgage Type
Purchase Money Mortgage
Purchase Details
Closed on
Feb 16, 2002
Sold by
Reyes David E and Sandoval Claudia
Bought by
Porterfield Edgar R and Joann Porterfield M
Purchase Details
Closed on
Aug 7, 1997
Sold by
Porterfield Edgar R and Porterfield Joann M
Bought by
Reyes David E and Sandoval Claudia
Create a Home Valuation Report for This Property
The Home Valuation Report is an in-depth analysis detailing your home's value as well as a comparison with similar homes in the area
Home Values in the Area
Average Home Value in this Area
Purchase History
| Date | Buyer | Sale Price | Title Company |
|---|---|---|---|
| Paz Family Trust | -- | None Listed On Document | |
| Paz Marco A | -- | None Available | |
| Paz Marco A | -- | United Title Company | |
| Paz Marco A | $150,000 | United Title Company | |
| Porterfield Edgar R | -- | -- | |
| Reyes David E | $500 | Northern Counties Title |
Source: Public Records
Mortgage History
| Date | Status | Borrower | Loan Amount |
|---|---|---|---|
| Previous Owner | Paz Marco A | $120,000 | |
| Closed | Paz Marco A | $30,000 |
Source: Public Records
Tax History Compared to Growth
Tax History
| Year | Tax Paid | Tax Assessment Tax Assessment Total Assessment is a certain percentage of the fair market value that is determined by local assessors to be the total taxable value of land and additions on the property. | Land | Improvement |
|---|---|---|---|---|
| 2025 | $2,499 | $213,240 | $49,750 | $163,490 |
| 2023 | $2,499 | $204,962 | $47,819 | $157,143 |
| 2022 | $2,407 | $200,944 | $46,882 | $154,062 |
| 2021 | $2,363 | $197,005 | $45,963 | $151,042 |
| 2020 | $2,338 | $194,986 | $45,492 | $149,494 |
| 2019 | $2,301 | $191,163 | $44,600 | $146,563 |
| 2018 | $2,257 | $187,416 | $43,726 | $143,690 |
| 2017 | $2,208 | $183,742 | $42,869 | $140,873 |
| 2016 | $2,187 | $180,140 | $42,029 | $138,111 |
| 2015 | $2,156 | $177,437 | $41,399 | $136,038 |
| 2014 | $2,011 | $173,963 | $40,589 | $133,374 |
Source: Public Records
Map
Nearby Homes
- 13855 Calada Dr
- 24365 Atwood Ave
- 13724 Sunray Ct
- 24244 Atwood Ave
- 24094 Atwood Ave
- 24058 Atwood Ave
- 13147 Indian St
- 13260 Moreno Way
- 24412 Eucalyptus Ave
- 24830 Lukewood Place
- 13960 Covey Quail Ln
- 24800 Carolyn Ave
- 24379 Myers Ave
- 12922 Heacock St
- 12902 Indian St
- 0 Eucalyptus Unit CV25156175
- 14157 Austene Cir
- 4812700 15 Myers Ave
- 1 Canyon House Rd
- 13591 Rundell Dr
- 24320 Dolan Dr
- 24314 Dolan Dr
- 24371 Bion Dr
- 24304 Dolan Dr
- 24325 Dolan Dr
- 24339 Dolan Dr
- 24351 Bion Dr
- 24340 Cottonwood Ave
- 24315 Dolan Dr
- 24330 Cottonwood Ave
- 24352 Cottonwood Ave
- 24345 Dolan Dr
- 24364 Cottonwood Ave
- 24381 Cottonwood Ave
- 24318 Cottonwood Ave
- 24292 Dolan Dr
- 24305 Dolan Dr
- 24376 Cottonwood Ave
- 24306 Cottonwood Ave
- 24293 Dolan Dr