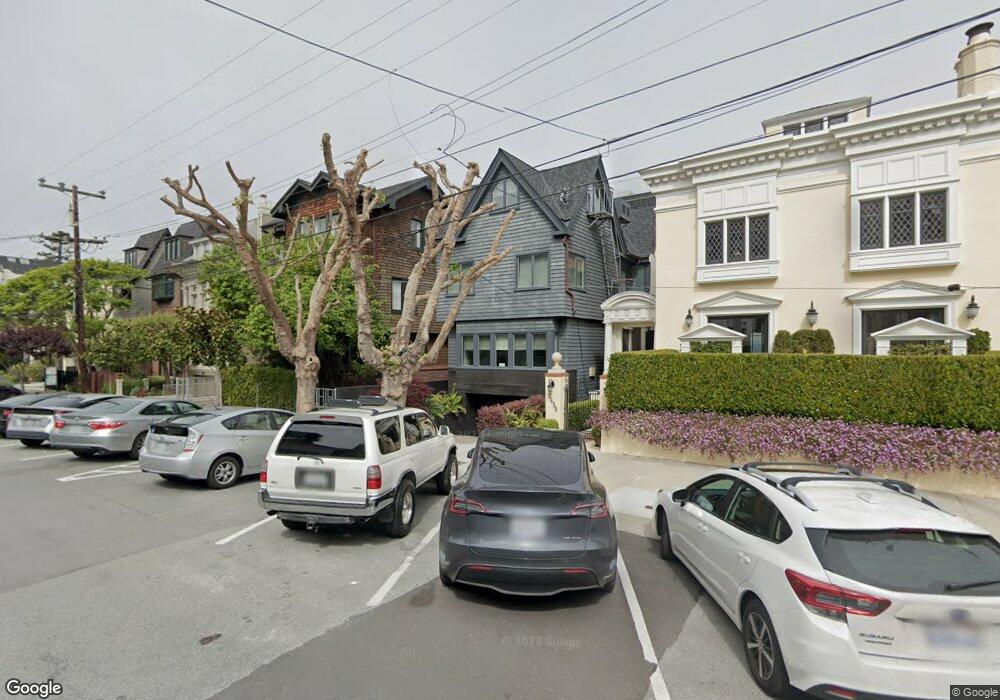
2434 Broadway St San Francisco, CA 94115
Pacific Heights NeighborhoodEstimated Value: $7,835,000 - $8,982,000
5
Beds
6
Baths
4,959
Sq Ft
$1,655/Sq Ft
Est. Value
About This Home
This home is located at 2434 Broadway St, San Francisco, CA 94115 and is currently estimated at $8,204,856, approximately $1,654 per square foot. 2434 Broadway St is a home located in San Francisco County with nearby schools including Cobb (William L.) Elementary School, Roosevelt Middle School, and Mary L. Booker Leadership Academy.
Ownership History
Date
Name
Owned For
Owner Type
Purchase Details
Closed on
Dec 22, 2022
Sold by
Park John C
Bought by
Park Arrie R
Current Estimated Value
Home Financials for this Owner
Home Financials are based on the most recent Mortgage that was taken out on this home.
Original Mortgage
$6,000,000
Outstanding Balance
$5,760,432
Interest Rate
5.35%
Mortgage Type
Construction
Estimated Equity
$2,444,424
Purchase Details
Closed on
Sep 8, 2011
Sold by
Everitt Albert M and Glander William J
Bought by
Park John C and Park Arrie R
Purchase Details
Closed on
Dec 22, 2010
Sold by
Everitt Albert and Ach Andrew
Bought by
Everitt Albert M and Lilienthal John G
Purchase Details
Closed on
Jul 25, 2005
Sold by
Brinton Mary Jane and Brinton Mary Jane Wiman
Bought by
Brinton William M and Fee Joseph M
Create a Home Valuation Report for This Property
The Home Valuation Report is an in-depth analysis detailing your home's value as well as a comparison with similar homes in the area
Home Values in the Area
Average Home Value in this Area
Purchase History
| Date | Buyer | Sale Price | Title Company |
|---|---|---|---|
| Park Arrie R | -- | First American Title | |
| Park John C | -- | Old Republic Title Company | |
| Everitt Albert M | -- | None Available | |
| Brinton William M | -- | -- |
Source: Public Records
Mortgage History
| Date | Status | Borrower | Loan Amount |
|---|---|---|---|
| Open | Park Arrie R | $6,000,000 | |
| Closed | Park Arrie R | $2,000,000 |
Source: Public Records
Tax History Compared to Growth
Tax History
| Year | Tax Paid | Tax Assessment Tax Assessment Total Assessment is a certain percentage of the fair market value that is determined by local assessors to be the total taxable value of land and additions on the property. | Land | Improvement |
|---|---|---|---|---|
| 2025 | $72,875 | $6,276,657 | $4,352,232 | $1,924,425 |
| 2024 | $72,875 | $6,153,587 | $4,266,895 | $1,886,692 |
| 2023 | $71,815 | $6,032,930 | $4,183,231 | $1,849,699 |
| 2022 | $70,510 | $5,914,638 | $4,101,207 | $1,813,431 |
| 2021 | $69,282 | $5,798,667 | $4,020,792 | $1,777,875 |
| 2020 | $69,572 | $5,739,210 | $3,979,564 | $1,759,646 |
| 2019 | $67,171 | $5,626,678 | $3,901,534 | $1,725,144 |
| 2018 | $64,899 | $5,516,353 | $3,825,034 | $1,691,319 |
| 2017 | $63,837 | $5,408,190 | $3,750,034 | $1,658,156 |
| 2016 | $62,325 | $5,252,148 | $3,676,504 | $1,575,644 |
| 2015 | $61,561 | $5,173,257 | $3,621,280 | $1,551,977 |
| 2014 | $59,934 | $5,071,921 | $3,550,345 | $1,521,576 |
Source: Public Records
Map
Nearby Homes
- 2755 Fillmore St
- 2651 Pierce St
- 2467 Pacific Ave
- 2500 Steiner St Unit 3
- 2546 Jackson St
- 2384 Union St
- 2190 Broadway St Unit 1W
- 2200 Pacific Ave Unit 8E
- 2200 Pacific Ave Unit 9E
- 2221 Scott St
- 2800 Pacific Ave
- 2725 Broadway St
- 2040 Broadway St Unit 102
- 2735 Clay St Unit 1
- 1990 Green St Unit 207
- 2830 Pacific Ave
- 2198 Jackson St
- 2850 Jackson St
- 3131 Pierce St Unit 406
- 2515 Sacramento St
- 2430 Broadway St
- 2440 Broadway St
- 2444 Broadway
- 2442 Broadway
- 2452 Broadway St Unit 2454
- 2404 Broadway St
- 2460 Broadway St
- 2464 Broadway St
- 2468 Broadway St
- 2400 Broadway St Unit 240A
- 2400 Broadway St
- 2715 Steiner St
- 2429 Vallejo St
- 2447 Vallejo St Unit 6
- 2447 Vallejo St Unit IT6
- 2447 Vallejo St Unit 5
- 2447 Vallejo St Unit 4
- 2447 Vallejo St Unit 3
- 2447 Vallejo St Unit 2
- 2447 Vallejo St Unit 1