Estimated Value: $376,014 - $413,000
2
Beds
2
Baths
1,484
Sq Ft
$266/Sq Ft
Est. Value
About This Home
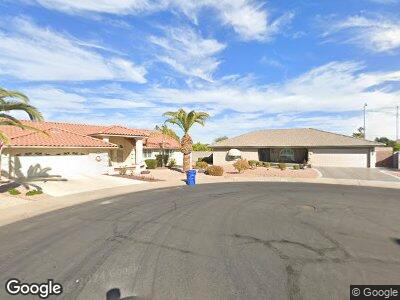
This home is located at 2435 S Zinnia Cir, Mesa, AZ 85209 and is currently estimated at $394,254, approximately $265 per square foot. 2435 S Zinnia Cir is a home located in Maricopa County with nearby schools including Boulder Creek Elementary School, Desert Ridge Jr. High School, and Desert Ridge High School.
Ownership History
Date
Name
Owned For
Owner Type
Purchase Details
Closed on
Mar 22, 2011
Sold by
Arch Romona R
Bought by
Catens Robert I and Castens Marilyn D
Current Estimated Value
Home Financials for this Owner
Home Financials are based on the most recent Mortgage that was taken out on this home.
Original Mortgage
$134,400
Outstanding Balance
$94,503
Interest Rate
4.83%
Mortgage Type
New Conventional
Estimated Equity
$299,751
Purchase Details
Closed on
Jan 24, 2005
Sold by
Swanson Norman D and Swanson Pearl J
Bought by
Arch Donald C and Arch Ramona R
Home Financials for this Owner
Home Financials are based on the most recent Mortgage that was taken out on this home.
Original Mortgage
$140,000
Interest Rate
5.73%
Mortgage Type
New Conventional
Purchase Details
Closed on
Nov 22, 1997
Sold by
Neslund Douglas A and Neslund Mary L
Bought by
Swanson Norman D and Swanson Pearl J
Create a Home Valuation Report for This Property
The Home Valuation Report is an in-depth analysis detailing your home's value as well as a comparison with similar homes in the area
Home Values in the Area
Average Home Value in this Area
Purchase History
| Date | Buyer | Sale Price | Title Company |
|---|---|---|---|
| Catens Robert I | $174,440 | Lawyers Title Of Arizona Inc | |
| Arch Donald C | $180,000 | Transnation Title | |
| Swanson Norman D | $140,000 | Transnation Title Ins Co |
Source: Public Records
Mortgage History
| Date | Status | Borrower | Loan Amount |
|---|---|---|---|
| Open | Catens Robert I | $134,400 | |
| Previous Owner | Arch Donald C | $140,000 |
Source: Public Records
Tax History Compared to Growth
Tax History
| Year | Tax Paid | Tax Assessment Tax Assessment Total Assessment is a certain percentage of the fair market value that is determined by local assessors to be the total taxable value of land and additions on the property. | Land | Improvement |
|---|---|---|---|---|
| 2025 | $1,659 | $23,295 | -- | -- |
| 2024 | $1,674 | $22,186 | -- | -- |
| 2023 | $1,674 | $28,080 | $5,610 | $22,470 |
| 2022 | $1,633 | $23,920 | $4,780 | $19,140 |
| 2021 | $1,769 | $21,850 | $4,370 | $17,480 |
| 2020 | $1,738 | $19,670 | $3,930 | $15,740 |
| 2019 | $1,611 | $18,220 | $3,640 | $14,580 |
| 2018 | $1,533 | $17,470 | $3,490 | $13,980 |
| 2017 | $1,486 | $17,070 | $3,410 | $13,660 |
| 2016 | $1,533 | $15,860 | $3,170 | $12,690 |
| 2015 | $1,413 | $15,030 | $3,000 | $12,030 |
Source: Public Records
Map
Nearby Homes
- 8303 E Meseto Ave
- 8351 E Monte Ave
- 3200 S Hawes Rd
- 8315 E Lobo Ave
- 8303 E Monterey Ave
- 8320 E Nido Ave
- 8217 E Medina Ave
- 8433 E Natal Cir
- 2552 S Peonie Cir
- 8536 E Milagro Ave
- 8064 E Madero Ave
- 2444 S Terrell
- 8531 E Natal Cir
- 8147 E Lakeview Ave
- 8039 E Madero Ave
- 8053 E Natal Ave
- 8011 E Milagro Ave
- 8025 E Medina Ave
- 8203 E Nopal Ave
- 7960 E Monte Ave
- 2435 S Zinnia Cir
- 2426 S Zinnia Cir
- 2441 S Zinnia Cir
- 8365 E Medina Ave
- 8357 E Medina Ave
- 2449 S Zinnia
- 2430 S Zinnia Cir
- 2438 S Zinnia Cir
- 8345 E Medina Ave
- 8416 E Meseto Cir
- 8415 E Meseto Cir
- 2457 S Zinnia
- 8347 E Meseto Ave
- 2361 S Zinnia
- 2423 S Verbena
- 2429 S Verbena
- 8422 E Meseto Cir
- 8421 E Meseto Cir
- 2437 S Verbena
- 8333 E Medina Ave