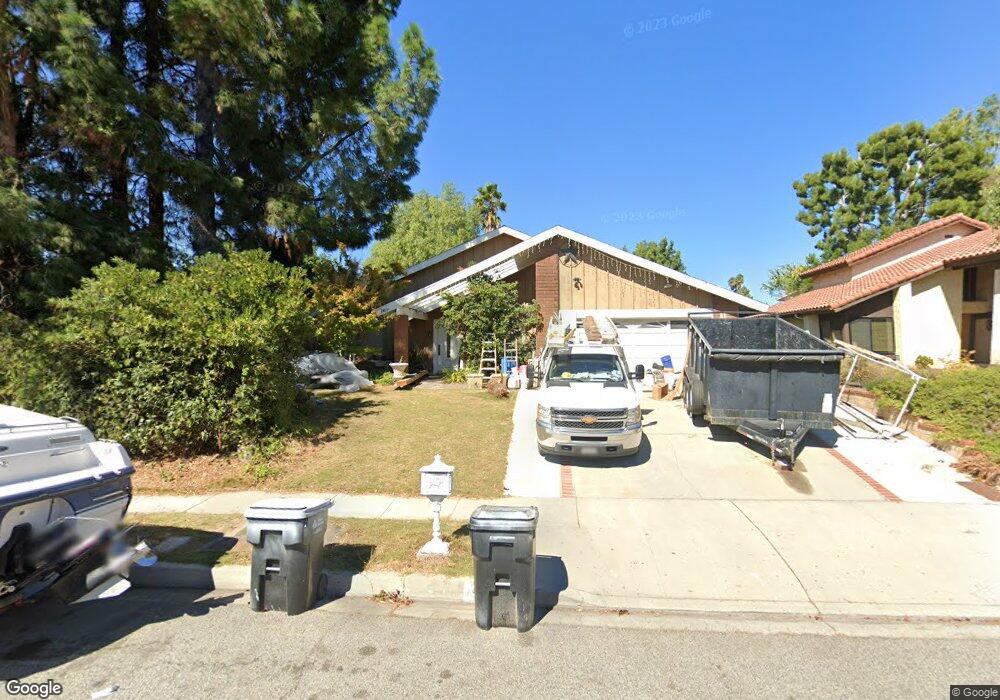
2437 Sirius St Thousand Oaks, CA 91360
Estimated Value: $936,333 - $1,054,000
3
Beds
2
Baths
1,611
Sq Ft
$609/Sq Ft
Est. Value
About This Home
This home is located at 2437 Sirius St, Thousand Oaks, CA 91360 and is currently estimated at $980,333, approximately $608 per square foot. 2437 Sirius St is a home located in Ventura County with nearby schools including Wildwood Elementary School, Redwood Middle School, and Thousand Oaks High School.
Ownership History
Date
Name
Owned For
Owner Type
Purchase Details
Closed on
Mar 25, 2002
Sold by
Mantor Larisa C
Bought by
Mantor Jack E
Current Estimated Value
Home Financials for this Owner
Home Financials are based on the most recent Mortgage that was taken out on this home.
Original Mortgage
$268,500
Outstanding Balance
$110,422
Interest Rate
6.84%
Estimated Equity
$869,911
Purchase Details
Closed on
Jul 12, 1999
Sold by
Bennett Neil and Bennett Dael
Bought by
Mantor Jack E and Mantor Larisa C
Home Financials for this Owner
Home Financials are based on the most recent Mortgage that was taken out on this home.
Original Mortgage
$215,900
Interest Rate
9%
Purchase Details
Closed on
Nov 11, 1996
Sold by
Smith Robert C
Bought by
Bennett Neil and Bennett Dael
Home Financials for this Owner
Home Financials are based on the most recent Mortgage that was taken out on this home.
Original Mortgage
$193,250
Interest Rate
7.76%
Mortgage Type
Balloon
Create a Home Valuation Report for This Property
The Home Valuation Report is an in-depth analysis detailing your home's value as well as a comparison with similar homes in the area
Home Values in the Area
Average Home Value in this Area
Purchase History
| Date | Buyer | Sale Price | Title Company |
|---|---|---|---|
| Mantor Jack E | -- | Fidelity National Title Co | |
| Mantor Jack E | $270,000 | American Title Co | |
| Bennett Neil | $215,000 | American Title Ins Co |
Source: Public Records
Mortgage History
| Date | Status | Borrower | Loan Amount |
|---|---|---|---|
| Open | Mantor Jack E | $268,500 | |
| Closed | Mantor Jack E | $215,900 | |
| Previous Owner | Bennett Neil | $193,250 | |
| Closed | Mantor Jack E | $54,000 |
Source: Public Records
Tax History Compared to Growth
Tax History
| Year | Tax Paid | Tax Assessment Tax Assessment Total Assessment is a certain percentage of the fair market value that is determined by local assessors to be the total taxable value of land and additions on the property. | Land | Improvement |
|---|---|---|---|---|
| 2025 | $4,535 | $365,017 | $116,135 | $248,882 |
| 2024 | $4,535 | $357,860 | $113,858 | $244,002 |
| 2023 | $4,388 | $350,844 | $111,626 | $239,218 |
| 2022 | $4,296 | $343,965 | $109,437 | $234,528 |
| 2021 | $4,204 | $337,221 | $107,291 | $229,930 |
| 2020 | $3,790 | $333,765 | $106,192 | $227,573 |
| 2019 | $3,689 | $327,221 | $104,110 | $223,111 |
| 2018 | $3,602 | $320,806 | $102,069 | $218,737 |
| 2017 | $3,528 | $314,517 | $100,068 | $214,449 |
| 2016 | $3,563 | $308,351 | $98,106 | $210,245 |
| 2015 | $3,505 | $303,722 | $96,634 | $207,088 |
| 2014 | $3,459 | $297,775 | $94,742 | $203,033 |
Source: Public Records
Map
Nearby Homes
- 226 Tennyson St
- 2651 Sirius St
- 212 Cedar Heights Dr
- 2590 Scott Place
- 136 Erten St
- 224 Whitworth St
- 2531 Scott Place
- 167 Siesta Ave
- 183 W Sidlee St
- 463 Serento Cir
- 479 Serento Cir
- 71 Del Ray Cir
- 2340 Aldrich Cir
- 2680 La Paloma Cir
- 2219 Goldsmith Ave
- 497 Azalea St
- 579 Shenandoah St
- 579 Rio Grande Cir
- 3037 Fort Courage Ave
- 3342 Heatherglow St
- 2453 Sirius St
- 144 Longfellow St
- 2421 Sirius St
- 152 Longfellow St
- 136 Longfellow St
- 2469 Sirius St
- 160 Longfellow St
- 2407 Sirius St
- 128 Longfellow St
- 2485 Sirius St
- 2434 Sirius St
- 2448 Sirius St
- 145 Longfellow St
- 2420 Sirius St
- 168 Longfellow St
- 153 Longfellow St
- 2462 Sirius St
- 2391 Sirius St
- 137 Longfellow St
- 2491 Sirius St