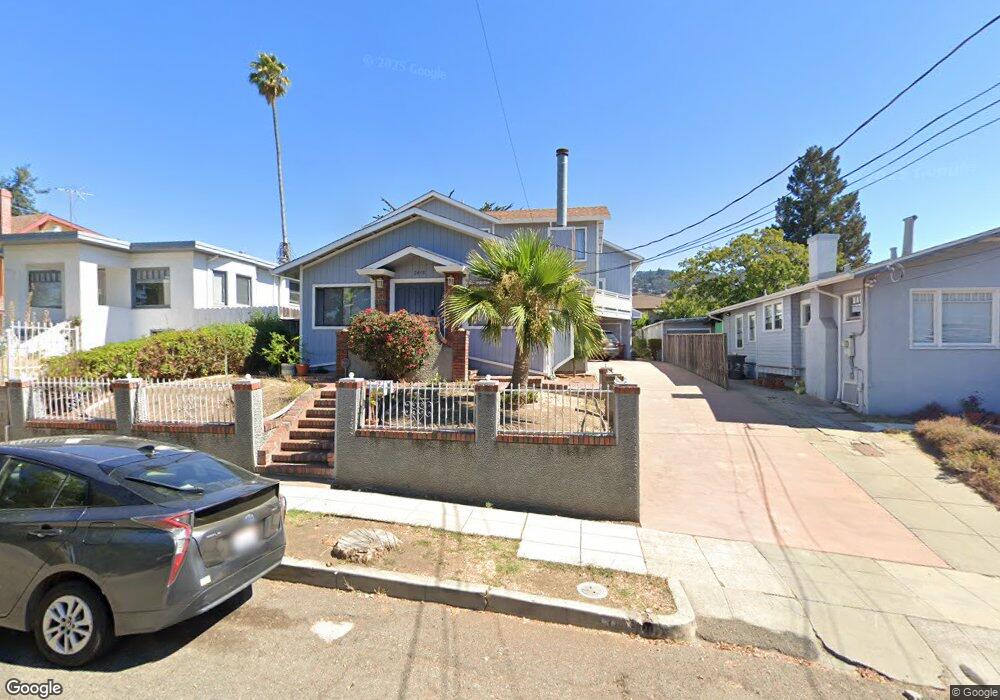
2438 Delmer St Oakland, CA 94602
Dimond District NeighborhoodEstimated Value: $916,000 - $1,522,000
5
Beds
4
Baths
3,152
Sq Ft
$387/Sq Ft
Est. Value
About This Home
This home is located at 2438 Delmer St, Oakland, CA 94602 and is currently estimated at $1,219,000, approximately $386 per square foot. 2438 Delmer St is a home located in Alameda County with nearby schools including Sequoia Elementary School, Bret Harte Middle School, and Skyline High School.
Ownership History
Date
Name
Owned For
Owner Type
Purchase Details
Closed on
Apr 17, 2020
Sold by
Trinh Alex and Trinh Mayling Chang
Bought by
Trinh Alex and Trinh Mayling Chang
Current Estimated Value
Purchase Details
Closed on
May 29, 2019
Sold by
Chang Trinh Alex and Chang Trinh Mayting
Bought by
Chang Trinh Alex and Chang Trinh Mayling
Home Financials for this Owner
Home Financials are based on the most recent Mortgage that was taken out on this home.
Original Mortgage
$393,000
Interest Rate
4.1%
Mortgage Type
Credit Line Revolving
Purchase Details
Closed on
Apr 2, 2002
Sold by
Trinh Alex and Trinh Mayling C
Bought by
Chang Trinh Alex and Chang Trinh Mayling
Home Financials for this Owner
Home Financials are based on the most recent Mortgage that was taken out on this home.
Original Mortgage
$300,700
Interest Rate
6.78%
Mortgage Type
Commercial
Create a Home Valuation Report for This Property
The Home Valuation Report is an in-depth analysis detailing your home's value as well as a comparison with similar homes in the area
Home Values in the Area
Average Home Value in this Area
Purchase History
| Date | Buyer | Sale Price | Title Company |
|---|---|---|---|
| Trinh Alex | -- | None Available | |
| Trinh Alex | -- | None Available | |
| Chang Trinh Alex | -- | Chicago Title Company | |
| Chang Trinh Alex | -- | Fidelity National Title Co |
Source: Public Records
Mortgage History
| Date | Status | Borrower | Loan Amount |
|---|---|---|---|
| Closed | Chang Trinh Alex | $393,000 | |
| Closed | Chang Trinh Alex | $300,700 | |
| Closed | Chang Trinh Alex | $81,000 |
Source: Public Records
Tax History
| Year | Tax Paid | Tax Assessment Tax Assessment Total Assessment is a certain percentage of the fair market value that is determined by local assessors to be the total taxable value of land and additions on the property. | Land | Improvement |
|---|---|---|---|---|
| 2025 | $8,008 | $450,191 | $137,157 | $320,034 |
| 2024 | $8,008 | $441,228 | $134,468 | $313,760 |
| 2023 | $8,306 | $439,440 | $131,832 | $307,608 |
| 2022 | $7,983 | $423,824 | $129,247 | $301,577 |
| 2021 | $7,507 | $415,377 | $126,713 | $295,664 |
| 2020 | $7,420 | $418,047 | $125,414 | $292,633 |
| 2019 | $7,060 | $409,850 | $122,955 | $286,895 |
| 2018 | $6,910 | $401,815 | $120,544 | $281,271 |
| 2017 | $6,611 | $393,938 | $118,181 | $275,757 |
| 2016 | $6,365 | $386,216 | $115,865 | $270,351 |
| 2015 | $6,326 | $380,416 | $114,125 | $266,291 |
| 2014 | $6,490 | $372,965 | $111,889 | $261,076 |
Source: Public Records
Map
Nearby Homes
- 2550 Carmel St
- 2550 Damuth St
- 3601 Lincoln Ave
- 3862 Lyman Rd
- 2833 Morgan Ave
- 2596 Macarthur Blvd
- 2600 Macarthur Blvd
- 2734 Macarthur Blvd
- 2818 Macarthur Blvd
- 2257 Macarthur Blvd
- 2901 Macarthur Blvd Unit 103
- 3464 Champion St
- 3425 Wilson Ave
- 2938 Morgan Ave
- 3017 Madeline St
- 3927 Canon Ave
- 3525 Dimond Ave
- 0 Frye St
- 3019 Florida St
- 3558 Maple Ave
Your Personal Tour Guide
Ask me questions while you tour the home.