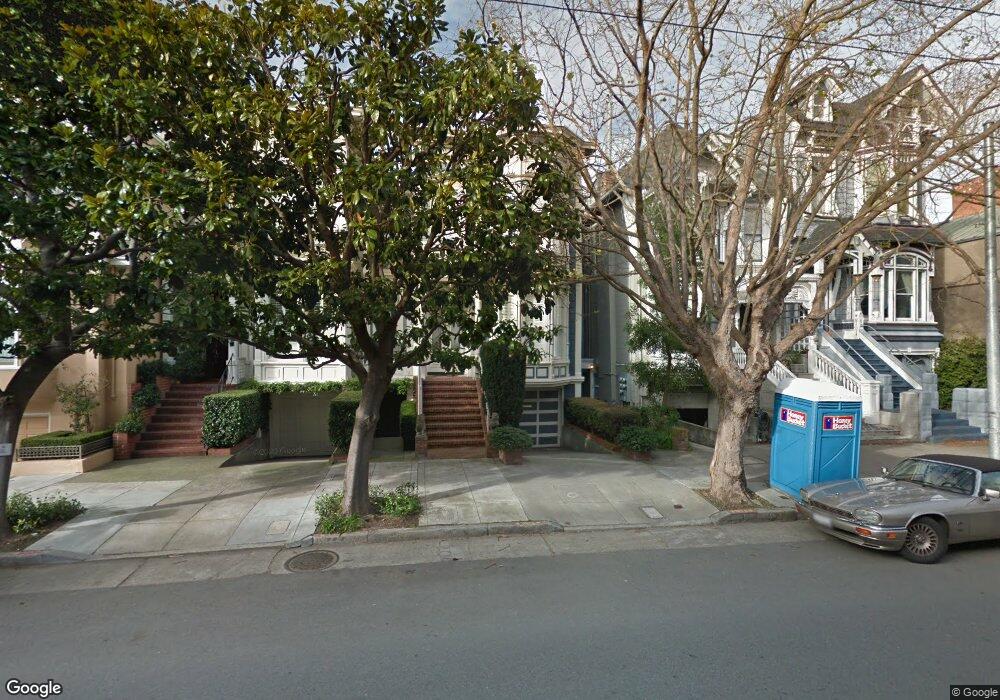
2438 Jackson St San Francisco, CA 94115
Pacific Heights NeighborhoodEstimated Value: $3,985,000 - $5,338,000
--
Bed
1
Bath
2,710
Sq Ft
$1,702/Sq Ft
Est. Value
About This Home
This home is located at 2438 Jackson St, San Francisco, CA 94115 and is currently estimated at $4,612,153, approximately $1,701 per square foot. 2438 Jackson St is a home located in San Francisco County with nearby schools including Sherman Elementary, Marina Middle School, and Mary L. Booker Leadership Academy.
Ownership History
Date
Name
Owned For
Owner Type
Purchase Details
Closed on
Apr 6, 2021
Sold by
Simms Soledad Marcia
Bought by
Simms Robert E
Current Estimated Value
Home Financials for this Owner
Home Financials are based on the most recent Mortgage that was taken out on this home.
Original Mortgage
$509,700
Outstanding Balance
$381,869
Interest Rate
2.9%
Mortgage Type
New Conventional
Estimated Equity
$4,230,285
Purchase Details
Closed on
Jun 26, 2007
Sold by
Jackson Susan M
Bought by
Simms Robert E
Purchase Details
Closed on
Dec 11, 2003
Sold by
Simms Robert E
Bought by
Jackson Susan M
Purchase Details
Closed on
Aug 21, 1997
Sold by
Christensen James A & Lucia B 1991 Trust and Kate C
Bought by
Simms Robert
Home Financials for this Owner
Home Financials are based on the most recent Mortgage that was taken out on this home.
Original Mortgage
$812,000
Interest Rate
7.5%
Create a Home Valuation Report for This Property
The Home Valuation Report is an in-depth analysis detailing your home's value as well as a comparison with similar homes in the area
Home Values in the Area
Average Home Value in this Area
Purchase History
| Date | Buyer | Sale Price | Title Company |
|---|---|---|---|
| Simms Robert E | -- | Cornerstone Title Company | |
| Simms Robert E | -- | None Available | |
| Jackson Susan M | -- | -- | |
| Simms Robert | -- | Commonwealth Land Title Co |
Source: Public Records
Mortgage History
| Date | Status | Borrower | Loan Amount |
|---|---|---|---|
| Open | Simms Robert E | $509,700 | |
| Previous Owner | Simms Robert | $812,000 |
Source: Public Records
Tax History Compared to Growth
Tax History
| Year | Tax Paid | Tax Assessment Tax Assessment Total Assessment is a certain percentage of the fair market value that is determined by local assessors to be the total taxable value of land and additions on the property. | Land | Improvement |
|---|---|---|---|---|
| 2025 | $18,642 | $1,620,701 | $798,377 | $822,324 |
| 2024 | $18,642 | $1,588,923 | $782,723 | $806,200 |
| 2023 | $18,374 | $1,557,769 | $767,376 | $790,393 |
| 2022 | $18,046 | $1,527,226 | $752,330 | $774,896 |
| 2021 | $17,733 | $1,497,281 | $737,579 | $759,702 |
| 2020 | $18,417 | $1,481,930 | $730,017 | $751,913 |
| 2019 | $17,783 | $1,452,873 | $715,703 | $737,170 |
| 2018 | $17,183 | $1,424,386 | $701,670 | $722,716 |
| 2017 | $16,680 | $1,396,458 | $687,912 | $708,546 |
| 2016 | $16,414 | $1,369,077 | $674,424 | $694,653 |
| 2015 | $16,210 | $1,348,513 | $664,294 | $684,219 |
| 2014 | $15,781 | $1,322,099 | $651,282 | $670,817 |
Source: Public Records
Map
Nearby Homes
- 2467 Pacific Ave
- 2500 Steiner St Unit 3
- 2755 Fillmore St
- 2190 Broadway St Unit 1W
- 2678 Sacramento St
- 2200 Pacific Ave Unit 8E
- 2200 Pacific Ave Unit 9E
- 2160 Vallejo St
- 2198 Jackson St
- 2760 Sacramento St Unit 12
- 2100 Green St Unit 206
- 2040 Broadway St Unit 102
- 2020 Webster St
- 2332 California St
- 2218 Clay St
- 2384 Union St
- 2800 Pacific Ave
- 2505 Divisadero St
- 2051 Scott St Unit 101
- 2725 Broadway St
- 2436 Jackson St Unit 1
- 2436 Jackson St Unit 4
- 2436 Jackson St Unit 2
- 2440 Jackson St
- 2442 Jackson St
- 2434 Jackson St
- 2500 Steiner St
- 2500 Steiner St Unit 12
- 2500 Steiner St Unit 11
- 2500 Steiner St Unit 10
- 2500 Steiner St Unit 9
- 2500 Steiner St Unit 8
- 2500 Steiner St Unit 7
- 2500 Steiner St Unit 6
- 2500 Steiner St Unit 5
- 2500 Steiner St Unit 4
- 2500 Steiner St Unit 2
- 2500 Steiner St Unit 1
- 2510 Steiner St
- 2475 Pacific Ave