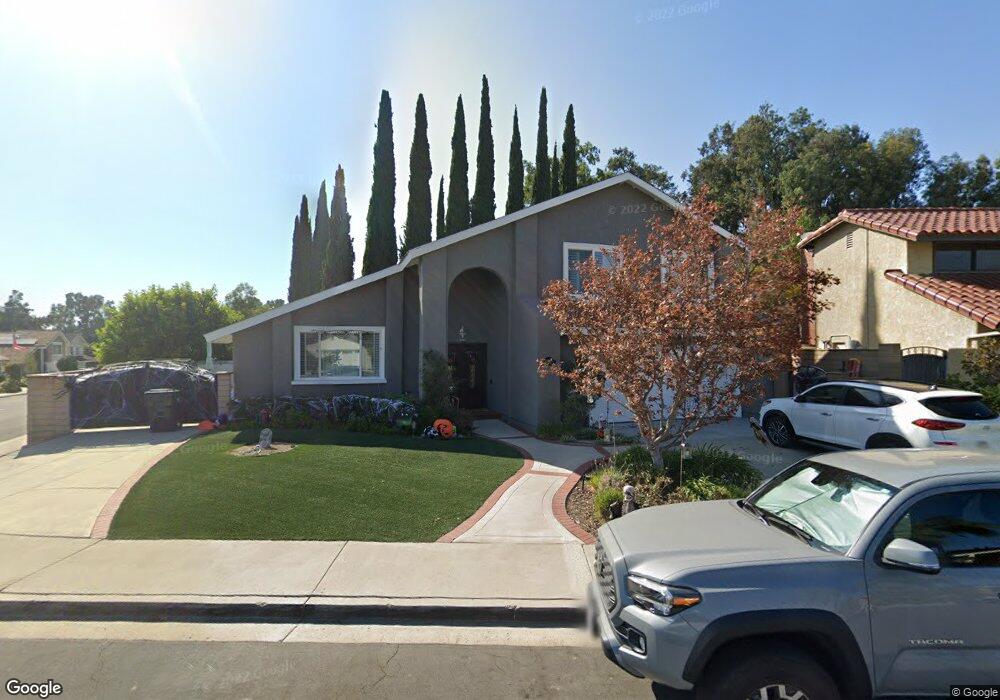
24411 Via Santa Clara Mission Viejo, CA 92692
Estimated Value: $1,364,000 - $1,807,000
4
Beds
4
Baths
2,313
Sq Ft
$651/Sq Ft
Est. Value
About This Home
This home is located at 24411 Via Santa Clara, Mission Viejo, CA 92692 and is currently estimated at $1,506,230, approximately $651 per square foot. 24411 Via Santa Clara is a home located in Orange County with nearby schools including Castille Elementary School, Newhart Middle School, and Capistrano Valley High School.
Ownership History
Date
Name
Owned For
Owner Type
Purchase Details
Closed on
May 10, 2023
Sold by
Stonbraker-Hall Jeannie Louise
Bought by
Lloll Family Trust
Current Estimated Value
Purchase Details
Closed on
Jun 24, 2019
Sold by
Stonbraker Hall Jeannie L and Hall Jeannie L
Bought by
Stonbraker Hall Jeannie L
Home Financials for this Owner
Home Financials are based on the most recent Mortgage that was taken out on this home.
Original Mortgage
$461,000
Interest Rate
3.7%
Mortgage Type
New Conventional
Purchase Details
Closed on
Nov 16, 1998
Sold by
Nellie Safford and Nellie Elizabeth
Bought by
Hall Charles S and Hall Jeannie L
Home Financials for this Owner
Home Financials are based on the most recent Mortgage that was taken out on this home.
Original Mortgage
$227,000
Interest Rate
6.66%
Purchase Details
Closed on
Mar 2, 1993
Sold by
Stoter Jack
Bought by
Safford Nellie and Hall Charles
Create a Home Valuation Report for This Property
The Home Valuation Report is an in-depth analysis detailing your home's value as well as a comparison with similar homes in the area
Home Values in the Area
Average Home Value in this Area
Purchase History
| Date | Buyer | Sale Price | Title Company |
|---|---|---|---|
| Lloll Family Trust | -- | None Listed On Document | |
| Stonbraker Hall Jeannie L | -- | First American Title Ins Co | |
| Hall Charles S | -- | First American Title Ins Co | |
| Safford Nellie | -- | -- |
Source: Public Records
Mortgage History
| Date | Status | Borrower | Loan Amount |
|---|---|---|---|
| Previous Owner | Stonbraker Hall Jeannie L | $461,000 | |
| Previous Owner | Hall Charles S | $227,000 |
Source: Public Records
Tax History Compared to Growth
Tax History
| Year | Tax Paid | Tax Assessment Tax Assessment Total Assessment is a certain percentage of the fair market value that is determined by local assessors to be the total taxable value of land and additions on the property. | Land | Improvement |
|---|---|---|---|---|
| 2025 | $5,654 | $568,119 | $289,203 | $278,916 |
| 2024 | $5,654 | $556,980 | $283,532 | $273,448 |
| 2023 | $5,535 | $546,059 | $277,972 | $268,087 |
| 2022 | $4,750 | $468,086 | $272,522 | $195,564 |
| 2021 | $4,658 | $458,908 | $267,178 | $191,730 |
| 2020 | $4,612 | $454,203 | $264,438 | $189,765 |
| 2019 | $4,451 | $445,298 | $259,253 | $186,045 |
| 2018 | $4,364 | $436,567 | $254,169 | $182,398 |
| 2017 | $4,277 | $428,007 | $249,185 | $178,822 |
| 2016 | $4,194 | $419,615 | $244,299 | $175,316 |
| 2015 | $4,146 | $413,312 | $240,629 | $172,683 |
| 2014 | $4,066 | $405,216 | $235,915 | $169,301 |
Source: Public Records
Map
Nearby Homes
- 24362 Via Santa Clara
- 24392 Macedo Dr
- 27382 Via Cortez
- 24712 San Vincent Ln
- 27724 Calle Valdes
- 27695 Via Turina
- 27748 Via Sarasate
- 27798 Espinoza
- 27828 Via Sarasate
- 27951 Faroles
- 24662 Embajadores Ln
- 26862 Salazar Dr
- 27858 Via Sarasate
- 27301 Via Avila
- 27843 Espinoza
- 27705 Via Rodrigo
- 27942 Via Granados
- 27865 Espinoza
- 27876 Torroba
- 27911 Sheffield
- 24401 Via Santa Clara
- 27451 Via Segundo
- 24391 Via Santa Clara
- 27431 Via Segundo
- 24412 Via Santa Clara
- 24402 Via Santa Clara
- 27452 Via Segundo
- 24422 Via Santa Clara
- 27442 Via Segundo
- 24375 Via Santa Clara
- 27462 Via Segundo
- 24392 Via Santa Clara
- 27421 Via Segundo
- 27432 Via Segundo
- 24372 Via Madrugada
- 24382 Via Madrugada
- 24376 Via Santa Clara
- 24361 Via Santa Clara
- 27411 Via Segundo
- 27422 Via Segundo