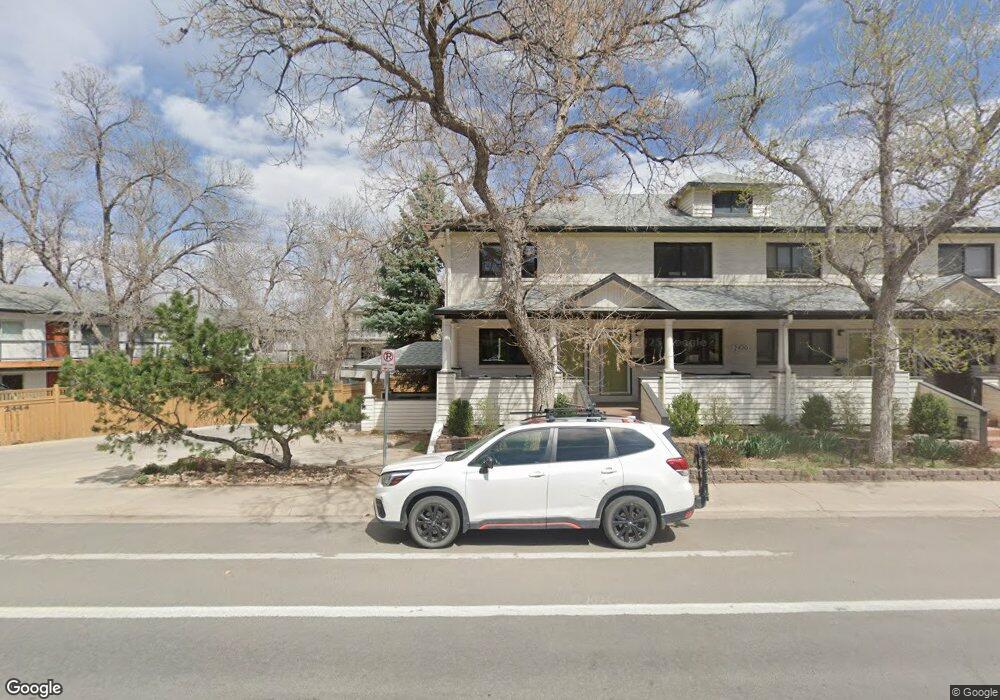
2444 9th St Unit 2 Boulder, CO 80304
Mapleton Hill NeighborhoodEstimated Value: $575,000 - $786,000
2
Beds
2
Baths
900
Sq Ft
$710/Sq Ft
Est. Value
About This Home
This home is located at 2444 9th St Unit 2, Boulder, CO 80304 and is currently estimated at $638,579, approximately $709 per square foot. 2444 9th St Unit 2 is a home located in Boulder County with nearby schools including Whittier Elementary School, Casey Middle School, and Boulder High School.
Ownership History
Date
Name
Owned For
Owner Type
Purchase Details
Closed on
Nov 23, 2020
Sold by
Groth Laura and Burger Brad
Bought by
Andren Peterson C and Andren Peterson Ingrid
Current Estimated Value
Purchase Details
Closed on
Sep 15, 2016
Sold by
Chin Wei Hua Chu
Bought by
Groth Lauren
Home Financials for this Owner
Home Financials are based on the most recent Mortgage that was taken out on this home.
Original Mortgage
$410,000
Interest Rate
3.43%
Mortgage Type
New Conventional
Purchase Details
Closed on
Dec 2, 2003
Sold by
Chin Wei Hua Chu
Bought by
Chin Wei Hua Chu and Wei Hua Chu Chin Trust
Purchase Details
Closed on
Jun 30, 1994
Sold by
Moddel Garret
Bought by
Chin Wei Hua Chu
Purchase Details
Closed on
Sep 24, 1985
Bought by
Groth Lauren and Groth Brad Burger
Purchase Details
Closed on
Dec 14, 1984
Bought by
Groth Lauren and Groth Brad Burger
Create a Home Valuation Report for This Property
The Home Valuation Report is an in-depth analysis detailing your home's value as well as a comparison with similar homes in the area
Home Values in the Area
Average Home Value in this Area
Purchase History
| Date | Buyer | Sale Price | Title Company |
|---|---|---|---|
| Andren Peterson C | $575,000 | Fidelity National Title | |
| Groth Lauren | $450,000 | Fidelity National Title | |
| Chin Wei Hua Chu | -- | -- | |
| Chin Wei Hua Chu | $197,500 | -- | |
| Groth Lauren | $102,500 | -- | |
| Groth Lauren | -- | -- |
Source: Public Records
Mortgage History
| Date | Status | Borrower | Loan Amount |
|---|---|---|---|
| Previous Owner | Groth Lauren | $410,000 |
Source: Public Records
Tax History
| Year | Tax Paid | Tax Assessment Tax Assessment Total Assessment is a certain percentage of the fair market value that is determined by local assessors to be the total taxable value of land and additions on the property. | Land | Improvement |
|---|---|---|---|---|
| 2025 | $3,416 | $38,950 | -- | $38,950 |
| 2024 | $3,416 | $38,950 | -- | $38,950 |
| 2023 | $3,354 | $37,969 | -- | $41,654 |
| 2022 | $3,586 | $37,808 | $0 | $37,808 |
| 2021 | $3,423 | $38,896 | $0 | $38,896 |
| 2020 | $3,306 | $37,981 | $0 | $37,981 |
| 2019 | $3,255 | $37,981 | $0 | $37,981 |
| 2018 | $2,872 | $33,120 | $0 | $33,120 |
| 2017 | $2,782 | $36,616 | $0 | $36,616 |
| 2016 | $2,576 | $29,762 | $0 | $29,762 |
| 2015 | $2,440 | $22,439 | $0 | $22,439 |
| 2014 | $1,929 | $22,439 | $0 | $22,439 |
Source: Public Records
Map
Nearby Homes
- 827 Maxwell Ave Unit E
- 1020 Portland Place
- 946 Portland Place
- 900 Portland Place
- 1009 Portland Place
- 1111 Maxwell Ave Unit 109
- 1111 Maxwell Ave Unit 105
- 1031 Portland Place Unit 4
- 643 Mapleton Ave
- 653 Dewey Ave
- 745 Highland Ave
- 604 Mapleton Ave
- 534 Dewey Ave
- 815 Alpine Ave Unit 2
- 934 Spruce St
- 613 Pine St
- 2449 5th St
- 2033 11th St Unit 3, 1
- 2409 5th St
- 515 Alpine Ave
- 2444 9th St Unit 10
- 2444 9th St Unit 9
- 2444 9th St Unit 8
- 2444 9th St Unit 7
- 2444 9th St Unit 6
- 2444 9th St Unit 5
- 2444 9th St Unit 3
- 2444 9th St Unit 1
- 2420 9th St Unit 1
- 2420 9th St Unit 16
- 2420 9th St Unit 15
- 2420 9th St Unit 14
- 2420 9th St Unit 13
- 2420 9th St Unit 12
- 2420 9th St Unit 11
- 2420 9th St
- 2420 9th St
- 2420 9th St Unit 5-legal 15
- 2420 9th St Unit 4
- 2420 9th St Unit 5
Your Personal Tour Guide
Ask me questions while you tour the home.