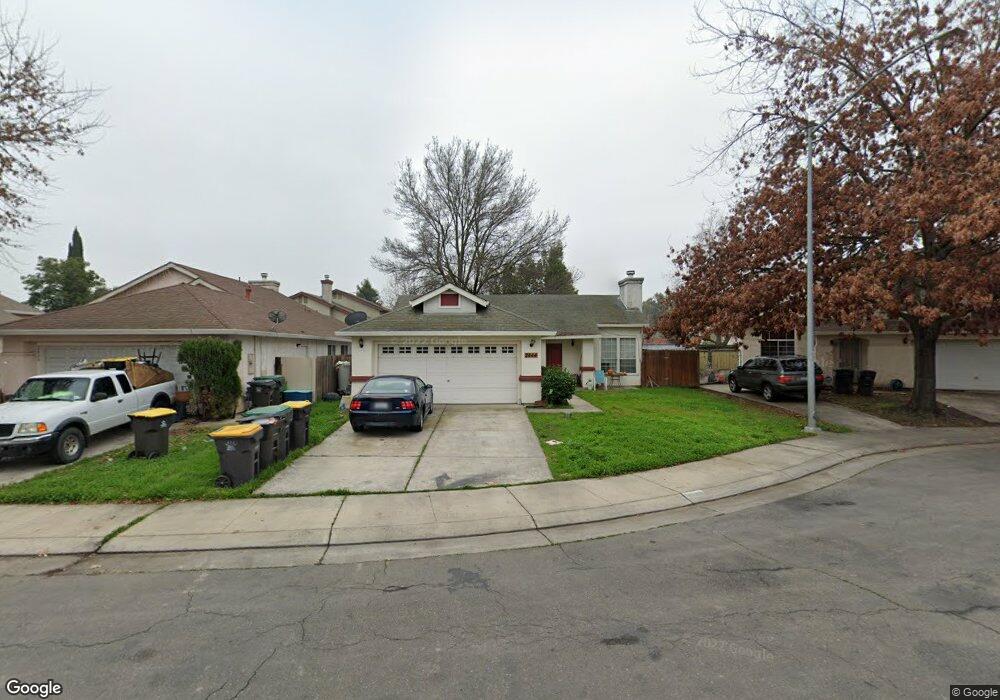
2444 Titleist Ct Stockton, CA 95206
Seaport NeighborhoodEstimated Value: $181,000 - $376,000
3
Beds
2
Baths
1,041
Sq Ft
$305/Sq Ft
Est. Value
About This Home
This home is located at 2444 Titleist Ct, Stockton, CA 95206 and is currently estimated at $317,613, approximately $305 per square foot. 2444 Titleist Ct is a home located in San Joaquin County with nearby schools including San Joaquin Elementary School, John Marshall Elementary School, and Taylor Leadership Academy.
Ownership History
Date
Name
Owned For
Owner Type
Purchase Details
Closed on
Jun 14, 2012
Sold by
Elder Phillip Glen and Elder Tammy Jean
Bought by
Singh Raminder and Gambhir Taneet K
Current Estimated Value
Purchase Details
Closed on
Oct 27, 2003
Sold by
Espinoza Luis Anders and Espinoza Patrice Avila
Bought by
Elder Phillip Glen and Elder Tammy Jean
Home Financials for this Owner
Home Financials are based on the most recent Mortgage that was taken out on this home.
Original Mortgage
$177,650
Interest Rate
6.35%
Mortgage Type
Purchase Money Mortgage
Purchase Details
Closed on
Aug 28, 1994
Sold by
Kaufman & Broad Central Valley Inc
Bought by
Espinoza Luis Andres and Espinoza Patrice Avila
Home Financials for this Owner
Home Financials are based on the most recent Mortgage that was taken out on this home.
Original Mortgage
$91,155
Interest Rate
8.65%
Mortgage Type
FHA
Create a Home Valuation Report for This Property
The Home Valuation Report is an in-depth analysis detailing your home's value as well as a comparison with similar homes in the area
Home Values in the Area
Average Home Value in this Area
Purchase History
| Date | Buyer | Sale Price | Title Company |
|---|---|---|---|
| Singh Raminder | $83,500 | None Available | |
| Elder Phillip Glen | $209,000 | Old Republic Title Co | |
| Espinoza Luis Andres | $92,000 | -- |
Source: Public Records
Mortgage History
| Date | Status | Borrower | Loan Amount |
|---|---|---|---|
| Previous Owner | Elder Phillip Glen | $177,650 | |
| Previous Owner | Espinoza Luis Andres | $91,155 | |
| Closed | Elder Phillip Glen | $31,350 |
Source: Public Records
Tax History Compared to Growth
Tax History
| Year | Tax Paid | Tax Assessment Tax Assessment Total Assessment is a certain percentage of the fair market value that is determined by local assessors to be the total taxable value of land and additions on the property. | Land | Improvement |
|---|---|---|---|---|
| 2025 | $1,579 | $114,514 | $28,319 | $86,195 |
| 2024 | $1,553 | $112,269 | $27,764 | $84,505 |
| 2023 | $1,519 | $110,069 | $27,220 | $82,849 |
| 2022 | $1,401 | $107,912 | $26,687 | $81,225 |
| 2021 | $1,352 | $105,797 | $26,164 | $79,633 |
| 2020 | $1,377 | $104,713 | $25,896 | $78,817 |
| 2019 | $1,372 | $102,661 | $25,389 | $77,272 |
| 2018 | $2,031 | $100,649 | $24,892 | $75,757 |
| 2017 | $1,813 | $98,676 | $24,404 | $74,272 |
| 2016 | $1,805 | $96,741 | $23,925 | $72,816 |
| 2014 | $1,720 | $93,422 | $23,104 | $70,318 |
Source: Public Records
Map
Nearby Homes
- 2050 Grey Stone Dr
- 1823 Fort Hall Place
- 2128 Green River Ln
- 2650 S Fresno Ave
- 1409 Laguna Cir
- 1413 Laguna Cir
- 2215 Dune Place
- 1232 Denver Ave
- 1156 Derrick Dr
- 2402 Sailboat Ct
- 2428 Shell Ct
- 2625 Crestmore Cir
- 2079 Gordon Verner Cir
- 3745 Wild Rose Ln
- 2242 Port Trinity Cir
- 864 W 5th St
- 3779 Zeally Ln
- 1890 Gordon Verner Cir
- 1661 W Hazelton Ave
- 1526 Kimiyo St
- 2452 Titleist Ct
- 2530 Almaden Ct
- 2428 Titleist Ct
- 2524 Almaden Ct
- 2460 Titleist Ct
- 2581 Houston Ave
- 2525 Almaden Ct
- 2420 Titleist Ct
- 2443 Titleist Ct
- 2468 Titleist Ct
- 2435 Titleist Ct
- 2565 Houston Ave
- 2518 Almaden Ct
- 2451 Titleist Ct
- 2427 Titleist Ct
- 2459 Titleist Ct
- 2412 Titleist Ct
- 2519 Almaden Ct
- 2549 Houston Ave
- 2419 Titleist Ct