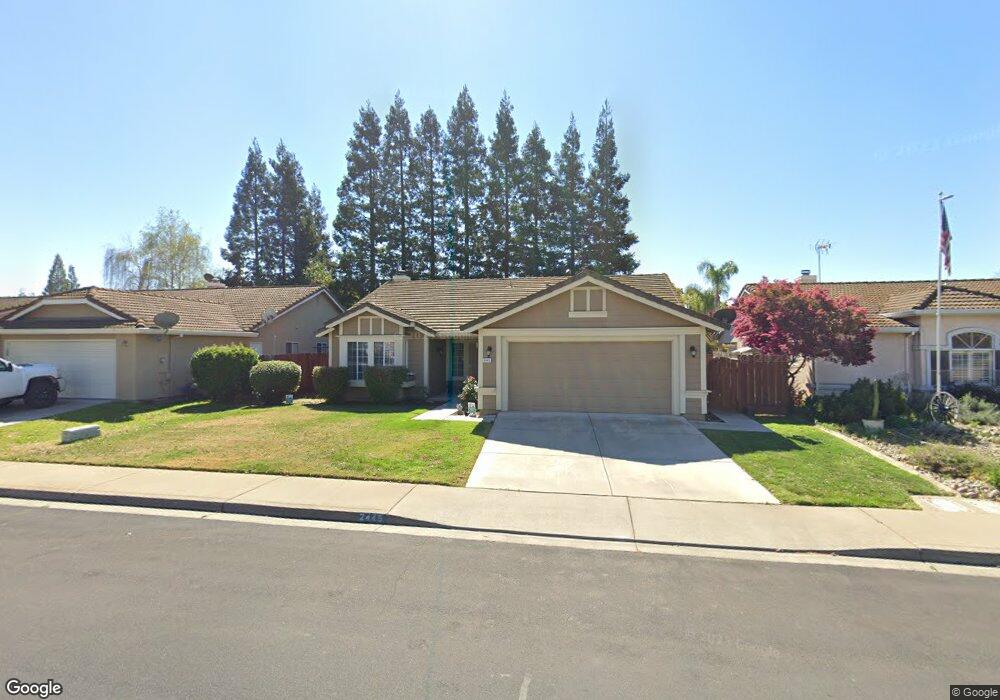
2445 Rainwood Ln Oakdale, CA 95361
Estimated Value: $426,000 - $534,000
3
Beds
2
Baths
1,467
Sq Ft
$322/Sq Ft
Est. Value
About This Home
This home is located at 2445 Rainwood Ln, Oakdale, CA 95361 and is currently estimated at $472,987, approximately $322 per square foot. 2445 Rainwood Ln is a home located in Stanislaus County with nearby schools including Fair Oaks Elementary School, Oakdale Junior High School, and East Stanislaus High School.
Ownership History
Date
Name
Owned For
Owner Type
Purchase Details
Closed on
Jun 28, 2017
Sold by
Johnson Karen Jean and Ross Nancy Joanne
Bought by
Ross Robert C and Ross Nancy J
Current Estimated Value
Purchase Details
Closed on
Aug 12, 2015
Sold by
Johnson Karen and Johnson Family Trust
Bought by
Johnson Karen Jean and Ross Nancy Joanne
Purchase Details
Closed on
Feb 15, 1996
Sold by
Johnson George W and Johnson Alice B
Bought by
Johnson George W and Johnson Alice Beverly
Purchase Details
Closed on
Apr 11, 1995
Sold by
Anderson Homes Inc
Bought by
Johnson George W and Johnson Alice B
Home Financials for this Owner
Home Financials are based on the most recent Mortgage that was taken out on this home.
Original Mortgage
$91,300
Interest Rate
8.6%
Create a Home Valuation Report for This Property
The Home Valuation Report is an in-depth analysis detailing your home's value as well as a comparison with similar homes in the area
Home Values in the Area
Average Home Value in this Area
Purchase History
| Date | Buyer | Sale Price | Title Company |
|---|---|---|---|
| Ross Robert C | -- | None Available | |
| Johnson Karen Jean | -- | None Available | |
| Johnson George W | -- | -- | |
| Johnson George W | $130,500 | Fidelity National Title |
Source: Public Records
Mortgage History
| Date | Status | Borrower | Loan Amount |
|---|---|---|---|
| Closed | Johnson George W | $91,300 |
Source: Public Records
Tax History Compared to Growth
Tax History
| Year | Tax Paid | Tax Assessment Tax Assessment Total Assessment is a certain percentage of the fair market value that is determined by local assessors to be the total taxable value of land and additions on the property. | Land | Improvement |
|---|---|---|---|---|
| 2025 | $1,026 | $91,937 | $26,259 | $65,678 |
| 2024 | $973 | $90,136 | $25,745 | $64,391 |
| 2023 | $953 | $88,370 | $25,241 | $63,129 |
| 2022 | $936 | $86,639 | $24,747 | $61,892 |
| 2021 | $921 | $84,941 | $24,262 | $60,679 |
| 2020 | $911 | $84,071 | $24,014 | $60,057 |
| 2019 | $897 | $82,424 | $23,544 | $58,880 |
| 2018 | $885 | $80,809 | $23,083 | $57,726 |
| 2017 | $869 | $79,226 | $22,631 | $56,595 |
| 2016 | $854 | $77,674 | $22,188 | $55,486 |
| 2015 | $844 | $76,508 | $21,855 | $54,653 |
| 2014 | $836 | $75,010 | $21,427 | $53,583 |
Source: Public Records
Map
Nearby Homes
- 2337 Rainwood Ln
- 2295 Pontiac St
- 2306 W F St
- 1972 Sugar Pine Dr
- 8400 Crane Rd
- 1948 Sugar Pine Dr
- 15 Willowood Dr
- The Skyline Plan at Saddlewood
- The Pinnacle Plan at Saddlewood
- The Vantage Plan at Saddlewood
- 311 Carriage Ln
- 1625 Valmor Ct
- 2532 Laurel Ridge Ct
- 2272 Tori Way
- 2908 Westport Cir
- 491 Nicholas Ct
- 549 Fresian Dr
- 2319 Tori Way
- 2376 Shire Way
- 2201 Mustang Dr
- 2421 Rainwood Ln
- 2469 Rainwood Ln
- 2382 Semillion Ct
- 2397 Rainwood Ln
- 2493 Rainwood Ln
- 245 Fairwood Dr
- 2374 Semillion Ct
- 2390 Semillion Ct
- 2390 2390 Semillion Ct
- 2385 Rainwood Ln
- 257 Cliffwood Way
- 2366 Semillion Ct
- 233 Fairwood Dr
- 2373 Rainwood Ln
- 263 Cliffwood Way
- 248 Fairwood Dr
- 2358 Semillion Ct
- 242 Fairwood Dr
- 254 Fairwood Dr
- 2397 Semillion Ct