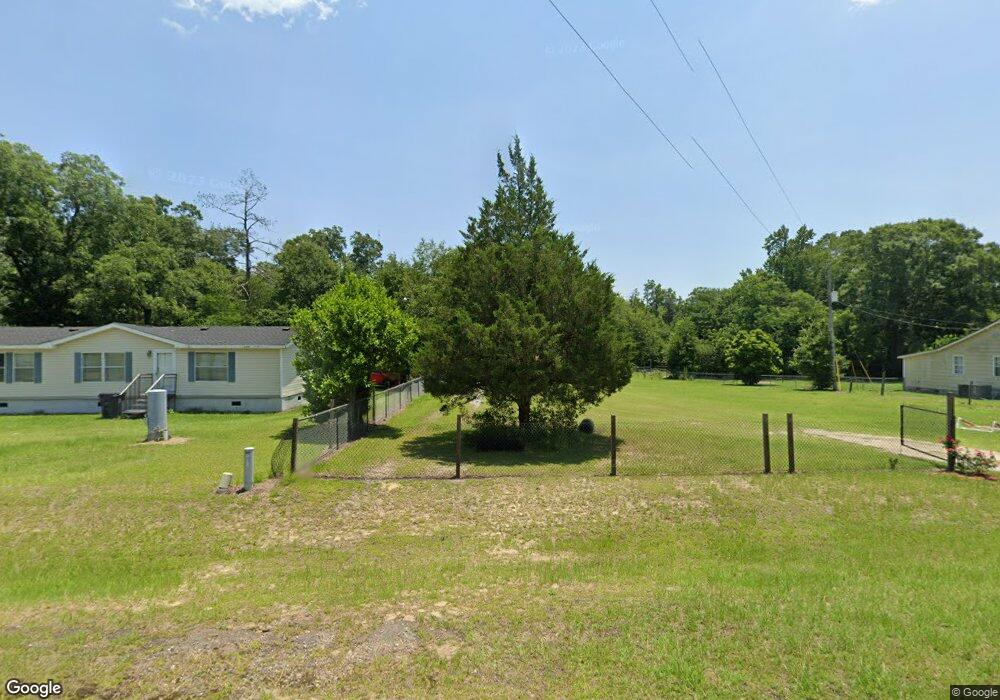
2447 Culpepper Rd Cordele, GA 31015
Estimated Value: $106,000 - $301,000
3
Beds
1
Bath
1,454
Sq Ft
$117/Sq Ft
Est. Value
About This Home
This home is located at 2447 Culpepper Rd, Cordele, GA 31015 and is currently estimated at $169,941, approximately $116 per square foot. 2447 Culpepper Rd is a home located in Crisp County with nearby schools including Crisp County Primary School, Crisp County Elementary School, and Crisp County Middle School.
Ownership History
Date
Name
Owned For
Owner Type
Purchase Details
Closed on
Mar 17, 2023
Sold by
Nicolas Juan Tomas
Bought by
Deleon Mynor and Deleon Francisco Micaela
Current Estimated Value
Purchase Details
Closed on
May 8, 2018
Sold by
Lpbd Properties Llc
Bought by
Juan-Tomas Nicolas and Juan Tomas Petrona
Home Financials for this Owner
Home Financials are based on the most recent Mortgage that was taken out on this home.
Original Mortgage
$33,578
Interest Rate
4.4%
Mortgage Type
Unknown
Purchase Details
Closed on
Jul 18, 2012
Sold by
Us Bank National Associati
Bought by
Lpbd Properties Llc
Purchase Details
Closed on
Jan 3, 2012
Sold by
Hughes Lloyd
Bought by
Us Bank National Association T
Purchase Details
Closed on
Feb 10, 2003
Sold by
Mcgahee Grandchild Trust
Bought by
Hughes Lloyd and Hughes Cynthia
Purchase Details
Closed on
Jan 1, 2002
Sold by
Mcgahee Grandchild Trust
Bought by
Mcgahee Grandchild Trust
Create a Home Valuation Report for This Property
The Home Valuation Report is an in-depth analysis detailing your home's value as well as a comparison with similar homes in the area
Home Values in the Area
Average Home Value in this Area
Purchase History
| Date | Buyer | Sale Price | Title Company |
|---|---|---|---|
| Deleon Mynor | $40,000 | -- | |
| Juan-Tomas Nicolas | $40,000 | -- | |
| Lpbd Properties Llc | $19,900 | -- | |
| Us Bank National Association T | $13,093 | -- | |
| Hughes Lloyd | $55,000 | -- | |
| Mcgahee Grandchild Trust | $65,000 | -- |
Source: Public Records
Mortgage History
| Date | Status | Borrower | Loan Amount |
|---|---|---|---|
| Previous Owner | Juan-Tomas Nicolas | $33,578 |
Source: Public Records
Tax History Compared to Growth
Tax History
| Year | Tax Paid | Tax Assessment Tax Assessment Total Assessment is a certain percentage of the fair market value that is determined by local assessors to be the total taxable value of land and additions on the property. | Land | Improvement |
|---|---|---|---|---|
| 2024 | $1,103 | $40,720 | $7,756 | $32,964 |
| 2023 | $1,096 | $39,019 | $7,756 | $31,263 |
| 2022 | $1,048 | $37,318 | $7,756 | $29,562 |
| 2021 | $1,056 | $35,617 | $7,756 | $27,861 |
| 2020 | $1,058 | $35,617 | $7,756 | $27,861 |
| 2019 | $461 | $35,617 | $7,756 | $27,861 |
| 2018 | $710 | $23,200 | $4,189 | $19,011 |
| 2017 | $713 | $23,200 | $4,189 | $19,011 |
| 2016 | $712 | $23,200 | $4,189 | $19,011 |
| 2015 | -- | $30,072 | $5,429 | $24,643 |
| 2014 | -- | $30,072 | $5,429 | $24,643 |
| 2013 | -- | $30,072 | $5,429 | $24,642 |
Source: Public Records
Map
Nearby Homes
- 141 Ruby St
- 112 Judy Ave
- 2298 U S 41
- TBD Aberdeen Circle Lt# 28
- 118 Joe Wright Drive New Harvest Rd
- 2608 U S 41
- 2115 Royal Rd
- 157 Bobwhite Dr
- 304 Timberland Dr
- 2776 2776 S Ga 41 Hwy
- 615 E 28th Ave
- 1606 S 5th St
- 618 E 27th Ave
- 607 E 27th Ave
- 1022 E 29th Ave
- 1506 S Joe Wright Dr
- 619 E 26th Ave
- 510 E 25th Ave
- 724 E 26th Ave
- 723 E 24th Ave
- 2455 Culpepper Rd
- 2441 Culpepper Rd
- 2459 Culpepper Rd
- 0 Culpepper Rd Unit 8467895
- 2437 Culpepper Rd
- 2429 Culpepper Rd
- 2423 Culpepper Rd
- BYRDS MILL Georgia 300
- S Georgia 300
- 2415 Culpepper Rd
- 2494 Culpepper Rd
- 204 Eddie Rd
- 2525 Culpepper Rd
- 173 Hanna Rd
- 169 Hanna Rd
- 181 Hanna Rd
- 163 Hanna Rd
- 185 Hanna Rd
- 159 Hanna Rd
- 170 Hanna Rd