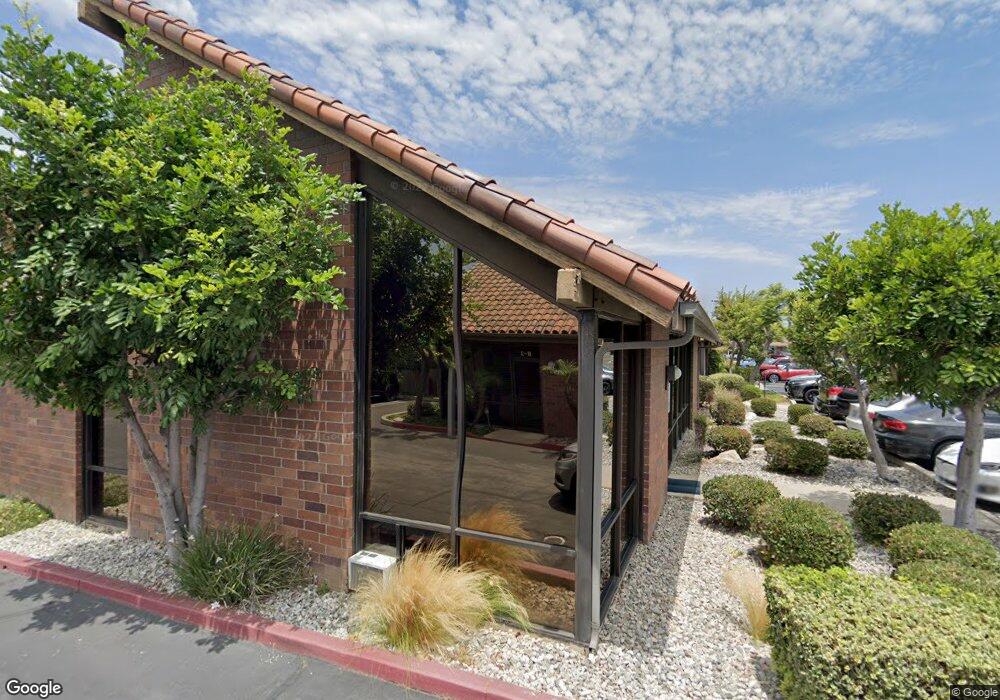
245 Fischer Ave Unit A7 Costa Mesa, CA 92626
University Park and Town Center NeighborhoodEstimated Value: $933,753
--
Bed
--
Bath
1,121
Sq Ft
$833/Sq Ft
Est. Value
About This Home
This home is located at 245 Fischer Ave Unit A7, Costa Mesa, CA 92626 and is currently estimated at $933,753, approximately $832 per square foot. 245 Fischer Ave Unit A7 is a home located in Orange County with nearby schools including Monroe Elementary School, McFadden Institute of Technology, and Century High School.
Ownership History
Date
Name
Owned For
Owner Type
Purchase Details
Closed on
Aug 18, 1998
Sold by
Boldman Millard K and Boldman Nancee E
Bought by
Kallenberger Mark and Kallenberger Suzie
Current Estimated Value
Home Financials for this Owner
Home Financials are based on the most recent Mortgage that was taken out on this home.
Original Mortgage
$155,300
Outstanding Balance
$32,398
Interest Rate
6.92%
Mortgage Type
Commercial
Estimated Equity
$901,355
Purchase Details
Closed on
Jan 14, 1997
Sold by
Boldman Millard K and Boldman Nancee E
Bought by
Boldman Millard K and Boldman Nancee E
Purchase Details
Closed on
Jan 13, 1997
Sold by
Sanwa Bank California
Bought by
Boldman Millard K and Boldman Nancee E
Purchase Details
Closed on
Mar 7, 1996
Sold by
Sharma Kris and Sharma Manju
Bought by
Sanwa Bank California
Purchase Details
Closed on
Feb 7, 1996
Sold by
Sharma Manju
Bought by
Mann Shelley and Omega Group
Create a Home Valuation Report for This Property
The Home Valuation Report is an in-depth analysis detailing your home's value as well as a comparison with similar homes in the area
Home Values in the Area
Average Home Value in this Area
Purchase History
| Date | Buyer | Sale Price | Title Company |
|---|---|---|---|
| Kallenberger Mark | $172,500 | First American Title Ins Co | |
| Boldman Millard K | -- | Old Republic Title Company | |
| Boldman Millard K | -- | Old Republic Title Company | |
| Sanwa Bank California | $155,000 | Commonwealth Land Title Co | |
| Mann Shelley | -- | United Title Company | |
| Mann Shelley | -- | United Title Company |
Source: Public Records
Mortgage History
| Date | Status | Borrower | Loan Amount |
|---|---|---|---|
| Open | Kallenberger Mark | $155,300 |
Source: Public Records
Tax History Compared to Growth
Tax History
| Year | Tax Paid | Tax Assessment Tax Assessment Total Assessment is a certain percentage of the fair market value that is determined by local assessors to be the total taxable value of land and additions on the property. | Land | Improvement |
|---|---|---|---|---|
| 2025 | $3,673 | $270,419 | $108,175 | $162,244 |
| 2024 | $3,673 | $265,117 | $106,054 | $159,063 |
| 2023 | $3,542 | $259,919 | $103,974 | $155,945 |
| 2022 | $3,391 | $254,823 | $101,935 | $152,888 |
| 2021 | $3,251 | $249,827 | $99,936 | $149,891 |
| 2020 | $3,255 | $247,266 | $98,911 | $148,355 |
| 2019 | $3,196 | $242,418 | $96,971 | $145,447 |
| 2018 | $3,082 | $237,665 | $95,069 | $142,596 |
| 2017 | $3,057 | $233,005 | $93,205 | $139,800 |
| 2016 | $2,998 | $228,437 | $91,378 | $137,059 |
| 2015 | $2,959 | $225,006 | $90,005 | $135,001 |
| 2014 | $2,908 | $220,599 | $88,242 | $132,357 |
Source: Public Records
Map
Nearby Homes
- 613 Lakeview Ln Unit 17
- 2864 Drake Ave
- 2817 Portola Dr
- 553 Sturgeon Dr
- 810 Baker St Unit 210
- 575 Traverse Dr
- 587 Traverse Dr
- 1572 Indus St
- 1632 Indus St
- 782 Hudson Ave
- 945 Brilliance Ln
- 20462 Santa Ana Ave Unit D
- 267 Mesa Dr
- 994 Valencia St
- 1010 Valencia St
- 333 Mesa Dr
- 1030 Palmetto Way
- 2233 Martin Unit 119
- 2233 Martin Unit 212
- 281 Santo Tomas Ave
- 245 Fischer Ave Unit C5
- 245 Fischer Ave Unit C6
- 245 Fischer Ave Unit D2
- 245 Fischer Ave Unit D7
- 245 Fischer Ave Unit A3
- 245 Fischer Ave Unit A2
- 245 Fischer Ave Unit C4
- 245 Fischer Ave Unit B6
- 245 Fischer Ave Unit A4
- 245 Fischer Ave Unit D6
- 245 Fischer Ave Unit D4
- 245 Fischer Ave Unit B6
- 245 Fischer Ave Unit B4
- 245 Fischer Ave Unit D8
- 245 Fischer Ave Unit A
- 245 Fischer Ave Unit B2
- 245 Fischer Ave Unit D3
- 245 Fischer Ave Unit B5
- 245 Fischer Ave Unit C2
- 245 Fischer Ave Unit C5