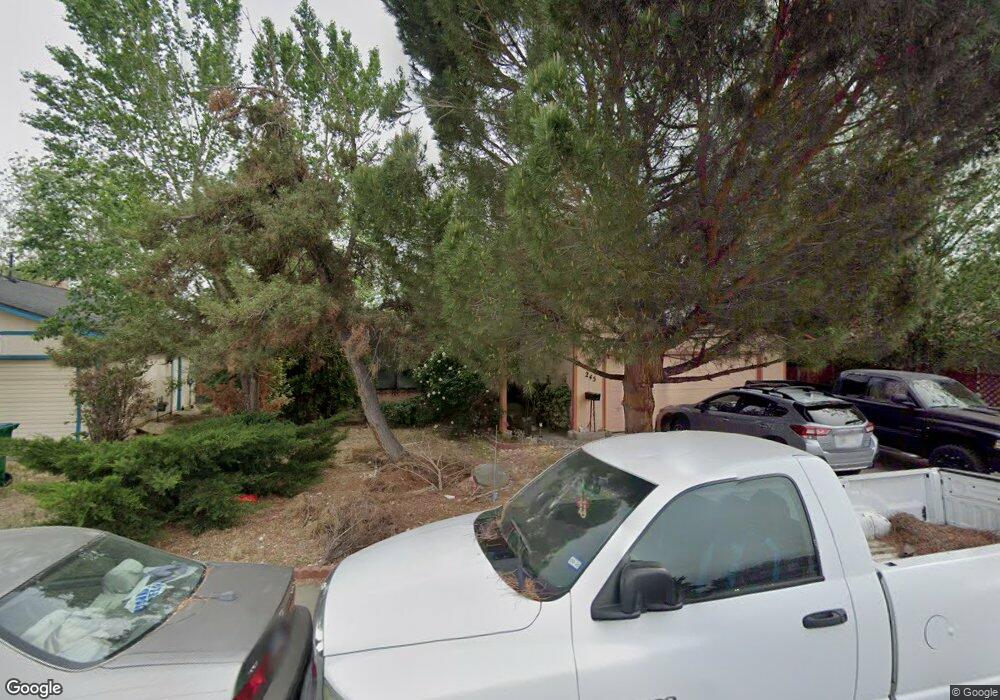
245 Gleeson Way Sparks, NV 89431
McCarran Boulevard-Probasco NeighborhoodEstimated Value: $450,000 - $456,000
4
Beds
2
Baths
1,770
Sq Ft
$256/Sq Ft
Est. Value
About This Home
This home is located at 245 Gleeson Way, Sparks, NV 89431 and is currently estimated at $453,226, approximately $256 per square foot. 245 Gleeson Way is a home located in Washoe County with nearby schools including Greenbrae Elementary School, George L Dilworth Middle School, and Sparks High School.
Ownership History
Date
Name
Owned For
Owner Type
Purchase Details
Closed on
Oct 2, 2008
Sold by
Echeveria Barboza Marcelino
Bought by
Sharifdeen Marita C and Sharifdeen Lafir M
Current Estimated Value
Home Financials for this Owner
Home Financials are based on the most recent Mortgage that was taken out on this home.
Original Mortgage
$140,000
Outstanding Balance
$90,096
Interest Rate
5.77%
Mortgage Type
Unknown
Estimated Equity
$363,130
Purchase Details
Closed on
Mar 25, 2005
Sold by
Rezek Edward L and Rezek Pamela D
Bought by
Echeveria Barboza Marcelino
Home Financials for this Owner
Home Financials are based on the most recent Mortgage that was taken out on this home.
Original Mortgage
$220,000
Interest Rate
7.05%
Mortgage Type
New Conventional
Create a Home Valuation Report for This Property
The Home Valuation Report is an in-depth analysis detailing your home's value as well as a comparison with similar homes in the area
Home Values in the Area
Average Home Value in this Area
Purchase History
| Date | Buyer | Sale Price | Title Company |
|---|---|---|---|
| Sharifdeen Marita C | $175,000 | First Centennial Reno | |
| Echeveria Barboza Marcelino | $275,000 | First Centennial Title Co |
Source: Public Records
Mortgage History
| Date | Status | Borrower | Loan Amount |
|---|---|---|---|
| Open | Sharifdeen Marita C | $140,000 | |
| Previous Owner | Echeveria Barboza Marcelino | $220,000 | |
| Closed | Echeveria Barboza Marcelino | $55,000 |
Source: Public Records
Tax History Compared to Growth
Tax History
| Year | Tax Paid | Tax Assessment Tax Assessment Total Assessment is a certain percentage of the fair market value that is determined by local assessors to be the total taxable value of land and additions on the property. | Land | Improvement |
|---|---|---|---|---|
| 2025 | $1,987 | $65,203 | $33,565 | $31,638 |
| 2024 | $1,841 | $62,738 | $30,065 | $32,673 |
| 2023 | $1,841 | $62,989 | $31,325 | $31,664 |
| 2022 | $1,706 | $53,112 | $26,180 | $26,932 |
| 2021 | $1,580 | $45,297 | $17,955 | $27,342 |
| 2020 | $1,485 | $44,861 | $16,940 | $27,921 |
| 2019 | $1,414 | $43,373 | $15,890 | $27,483 |
| 2018 | $1,350 | $39,091 | $11,725 | $27,366 |
| 2017 | $1,295 | $38,235 | $10,395 | $27,840 |
| 2016 | $1,263 | $38,152 | $9,345 | $28,807 |
| 2015 | $644 | $36,915 | $7,700 | $29,215 |
| 2014 | $1,221 | $34,910 | $6,440 | $28,470 |
| 2013 | -- | $32,676 | $4,270 | $28,406 |
Source: Public Records
Map
Nearby Homes
- 385 Gleeson Way
- 370 O'Brien Way
- 848 Parkside Dr Unit 1
- 8 E O St
- 300 I St
- 801 Woodglen Dr Unit 2
- 360 E Lincoln Way
- 949 Crestwood Dr Unit 3
- 1703 1st St
- 684 Oakwood Dr Unit 3
- 644 Oakwood Dr Unit 2
- 611 Oakwood Dr Unit 1
- 601 Oakwood Dr Unit 4
- 445 Pine Meadows Dr Unit E25
- 604 Oakwood Dr Unit 1
- 10 Lincoln Way
- 345 H St
- 560 Nichols Blvd
- 857 Cherry Tree Dr Unit 3
- 907 Camino Real Dr
- 255 Gleeson Way
- 1130 Breaker Way
- 244 E I St
- 275 Gleeson Way
- 1110 Breaker Way
- 254 E I St
- 240 Gleeson Way
- 1200 Breaker Way
- 264 E I St
- 260 Gleeson Way
- 285 Gleeson Way
- 1131 Breaker Way
- 1111 Breaker Way
- 1161 Breaker Way
- 1244 Breaker Ct
- 284 E I St
- 270 Gleeson Ct
- 1211 Breaker Way
- 134 E I St
- 1240 Breaker Way