245 Sulphur Spring Rd Ballwin, MO 63021
Estimated Value: $225,000 - $247,000
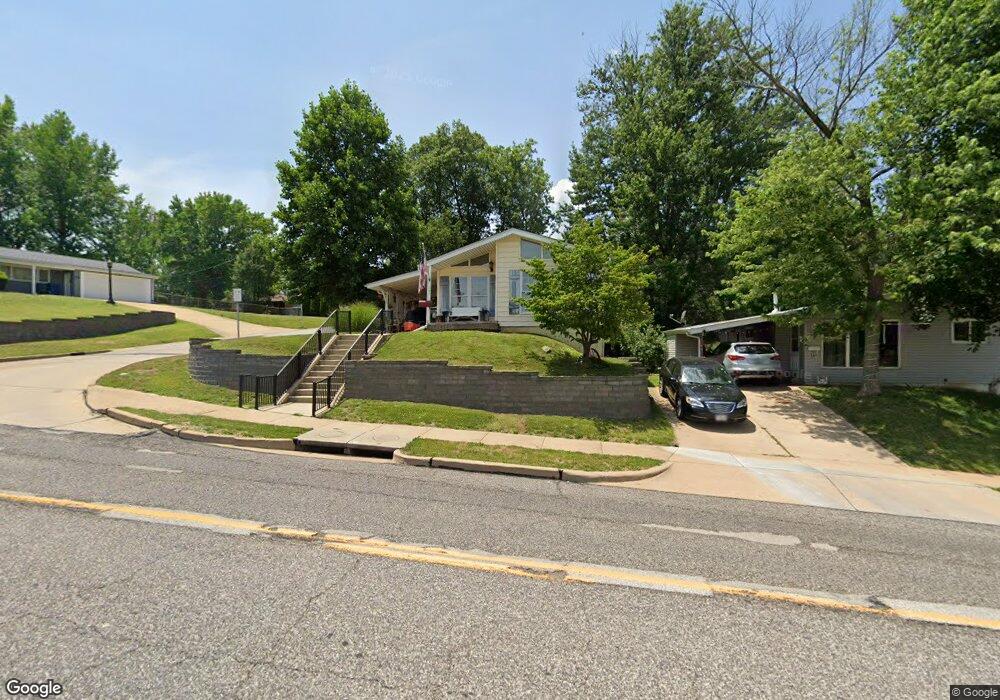
About This Home
This home is located at 245 Sulphur Spring Rd, Ballwin, MO 63021 and is currently estimated at $235,566, approximately $270 per square foot. 245 Sulphur Spring Rd is a home located in St. Louis County with nearby schools including Sorrento Springs Elementary School, Parkway Southwest Middle School, and Parkway South High School.
Ownership History
We collect this data history from publicly available records. To have your information removed, we recommend requesting removal directly through your county’s website.
Purchase Details
Purchase Details
Home Financials for this Owner
Home Financials are based on the most recent Mortgage that was taken out on this home.Purchase Details
Home Financials for this Owner
Home Financials are based on the most recent Mortgage that was taken out on this home.Purchase Details
Home Values in the Area
Average Home Value in this Area
Purchase History
We collect this data history from publicly available records. To have your information removed, we recommend requesting removal directly through your county’s website.
| Date | Buyer | Sale Price | Title Company |
|---|---|---|---|
| -- | None Available | ||
| $135,000 | Clear Title Group | ||
| $114,000 | -- | ||
| -- | -- |
Mortgage History
We collect this data history from publicly available records. To have your information removed, we recommend requesting removal directly through your county’s website.
| Date | Status | Borrower | Loan Amount |
|---|---|---|---|
| Open | $115,000 | ||
| Previous Owner | $91,200 | ||
| Closed | $11,400 |
Tax History
We collect this data history from publicly available records. To have your information removed, we recommend requesting removal directly through your county’s website.
| Year | Tax Paid | Tax Assessment Tax Assessment Total Assessment is a certain percentage of the fair market value that is determined by local assessors to be the total taxable value of land and additions on the property. | Land | Improvement |
|---|---|---|---|---|
| 2025 | $2,155 | $36,550 | $21,220 | $15,330 |
| 2024 | $2,155 | $32,660 | $15,920 | $16,740 |
| 2023 | $2,174 | $32,660 | $15,920 | $16,740 |
| 2022 | $2,240 | $30,850 | $15,920 | $14,930 |
| 2021 | $2,228 | $30,850 | $15,920 | $14,930 |
| 2020 | $2,013 | $26,600 | $13,000 | $13,600 |
| 2019 | $1,989 | $26,600 | $13,000 | $13,600 |
| 2018 | $2,010 | $24,870 | $10,410 | $14,460 |
| 2017 | $1,987 | $24,870 | $10,410 | $14,460 |
| 2016 | $1,859 | $22,020 | $8,700 | $13,320 |
| 2015 | $1,942 | $22,020 | $8,700 | $13,320 |
| 2014 | $1,563 | $19,720 | $5,740 | $13,980 |
Map
- 309 Wembley Ln
- 236 Hillcrest Blvd
- 502 Wicklow Dr
- 510 Wicklow Dr
- 0 Unknown Unit MIS26026469
- 0 Unknown Unit MIS26026473
- 0 Unknown Unit MIS26026288
- 0 Unknown Unit MIS26026471
- 0 Unknown Unit MIS26026466
- 17 Saint Lawrence Dr
- 28 James Ct
- 804 Joyceann Dr
- 0 the Indigo H @ Lock Dr
- 0 the Rainier F @ Lock Dr
- 19 Cloverleaf Ln
- 36 Firefly Ct
- 159 Spring Oaks Dr
- 180 Spring Oaks Dr
- 798 Canary Dr
- 153 Spring Leigh Ct
- 241 Sulphur Spring Rd
- 237 Sulphur Spring Rd
- 441 Orchard Ave
- 233 Sulphur Spring Rd
- 437 Orchard Ave
- 442 Orchard Ave
- 444 Orchard Ave
- 433 Orchard Ave
- 229 Sulphur Spring Rd
- 438 Orchard Ave
- 440 Ballwin Ave
- 434 Orchard Ave
- 436 Ballwin Ave
- 429 Orchard Ave
- 225 Sulphur Spring Rd
- 432 Ballwin Ave
- 430 Orchard Ave
- 425 Orchard Ave
- 441 Hillcrest Blvd
- 428 Ballwin Ave
Ask me questions while you tour the home.